终极振荡器
原文:
www.backtrader.com/blog/posts/2016-06-22-ultimate-oscillator/ultimate-oscillator/
当启动backtrader的开发时,其中一个目标是使其非常容易(至少对于作者本人来说)开发新的Indicators以测试数学和视觉上的想法。
Ticket #102是关于将UltimateOscillator添加到backtrader的武器库中
注意
它将在下一个版本中添加,同时可以使用下面的代码来使用它。
如票号中所示的参考资料:
以及在:
这里不需要重复。
引用自参考资料:
BP = Close - Minimum(Low or Prior Close)

TR = Maximum(High or Prior Close)  -  Minimum(Low or Prior Close)

Average7 = (7-period BP Sum) / (7-period TR Sum)
Average14 = (14-period BP Sum) / (14-period TR Sum)
Average28 = (28-period BP Sum) / (28-period TR Sum)

UO = 100 x [(4 x Average7)+(2 x Average14)+Average28]/(4+2+1)
摘要:
-
首先从
bt.Indicator中派生子类,以确保整个机制运作正常:class UltimateOscillator(bt.Indicator):` -
它有 1 个输出行:我们将命名为
uo:lines = ('uo',)` -
它有 3 个参数,定义了 3 个周期,默认值为
7、14和28。将命名为p1、p2和p3:params = (('p1', 7), ('p2', 14), ('p3', 28), )` -
计算使用了backtrader中已经内置的一些东西
最小(低价或前收盘价):这是由Welles Wilder为RSI指标定义的TrueLow。因此,可以计算出BP或买入压力:
bp = self.data.close - TrueLow(self.data)`最大(低价或前收盘价) - 最小(低价或前收盘价):这是由Welles Wilder为RSI指标定义的TrueRange(可以表示为TrueHigh - TrueLow)。因此,下一个计算就像这样简单:
tr = TrueRange(self.data)`- 其余部分都是纯数学运算,使用
SumN来加上最新的p1、p2、p3周期的bp和tr,加上加权计算:
av7 = SumN(bp, period=self.p.p1) / SumN(tr, period=self.p.p1) av14 = SumN(bp, period=self.p.p2) / SumN(tr, period=self.p.p2) av28 = SumN(bp, period=self.p.p3) / SumN(tr, period=self.p.p3) uo = 100.0 * (4.0 * av7 + 2.0 * av14 + av28) / (4.0 + 2.0 + 1.0)`- 最后将计算分配给定义的
uo线:
self.lines.uo = uo`
看起来比实际长度长(包括导入的全部代码)位于底部。
由于我们不仅想要值,还想要一个漂亮的图表,就像Stockcharts提供的图表一样,我们将添加两个额外的触摸:
-
2 个参数确定放置水平线的位置,以限定超买和超卖区域(类似于
RSI或Stochastic):('upperband', 70.0), ('lowerband', 30.0),` -
以及绘图初始化代码以使用参数。像Stockcharts中的绘图一样,在
10、50和90处添加刻度:def _plotinit(self): baseticks = [10.0, 50.0, 90.0] hlines = [self.p.upperband, self.p.lowerband] self.plotinfo.plotyhlines = hlines self.plotinfo.plotyticks = baseticks + hlines`
为了测试和进一步使用backtrader提供的现有工具,将使用与backtrader一起安装的btrun可执行文件。
-
指标存储在名为
ultimateoscillator.py的文件中 -
使用的数据是backtrader源代码中可用的数据样本之一
-
该指标将使用默认参数添加两次,并使用较短期的参数添加两次
执行:
btrun \
  --nostdstats \
  --data 2005-2006-day-001.txt \
  --indicator ultimateoscillator:UltimateOscillator \
  --indicator ultimateoscillator:UltimateOscillator:p1=4,p2=8,p3=16 \
  --plot
注意
使用–nostdstats来移除图表中的一些观察者。在这种情况下,无需跟踪现金和价值
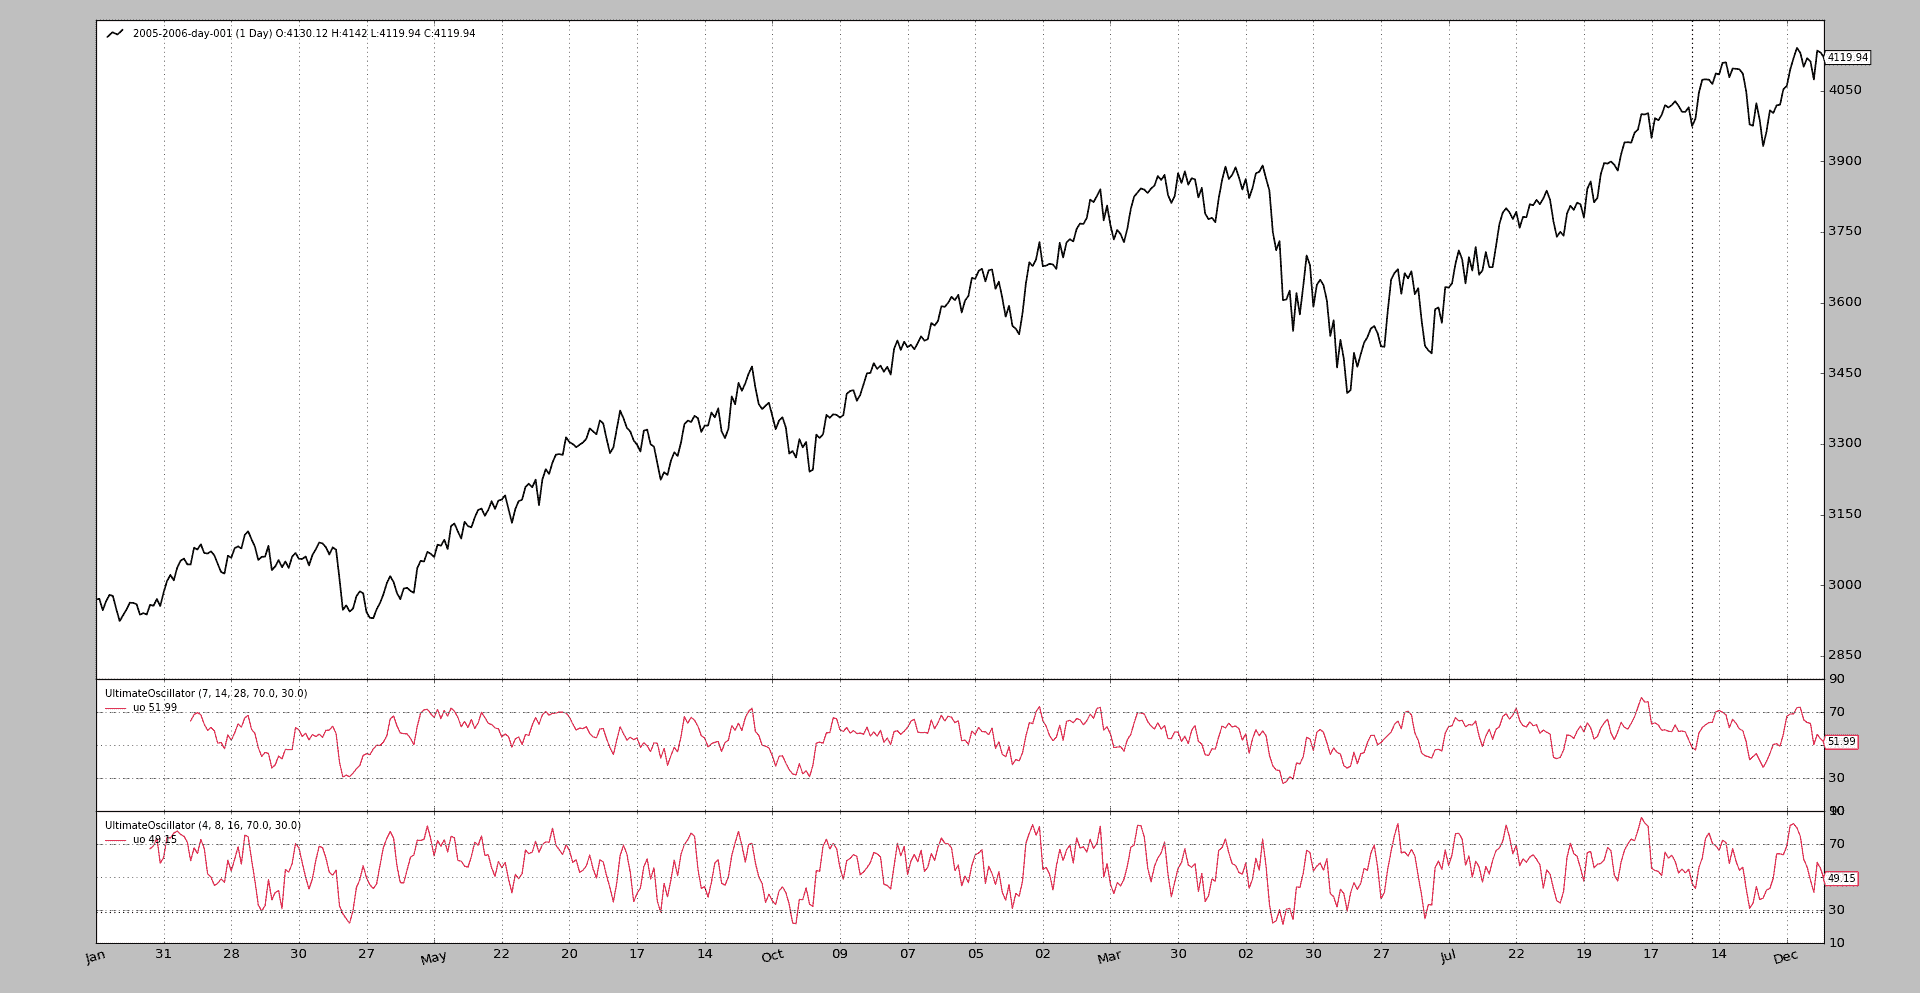
输出只是显示 UltimateOscillator 演变的图表。
UltimateOscillator 代码:
from __future__ import (absolute_import, division, print_function,
                        unicode_literals)

import backtrader as bt
from backtrader.indicators import SumN, TrueLow, TrueRange

class UltimateOscillator(bt.Indicator):
    '''
    Formula:
      # Buying Pressure = Close - TrueLow
      BP = Close - Minimum(Low or Prior Close)

      # TrueRange = TrueHigh - TrueLow
      TR = Maximum(High or Prior Close)  -  Minimum(Low or Prior Close)

      Average7 = (7-period BP Sum) / (7-period TR Sum)
      Average14 = (14-period BP Sum) / (14-period TR Sum)
      Average28 = (28-period BP Sum) / (28-period TR Sum)

      UO = 100 x [(4 x Average7)+(2 x Average14)+Average28]/(4+2+1)

    See:

      - https://en.wikipedia.org/wiki/Ultimate_oscillator
      - http://stockcharts.com/school/doku.php?id=chart_school:technical_indicators:ultimate_oscillator
    '''
    lines = ('uo',)

    params = (('p1', 7),
              ('p2', 14),
              ('p3', 28),
              ('upperband', 70.0),
              ('lowerband', 30.0),
    )

    def _plotinit(self):
        baseticks = [10.0, 50.0, 90.0]
        hlines = [self.p.upperband, self.p.lowerband]

        self.plotinfo.plotyhlines = hlines
        self.plotinfo.plotyticks = baseticks + hlines

    def __init__(self):
        bp = self.data.close - TrueLow(self.data)
        tr = TrueRange(self.data)

        av7 = SumN(bp, period=self.p.p1) / SumN(tr, period=self.p.p1)
        av14 = SumN(bp, period=self.p.p2) / SumN(tr, period=self.p.p2)
        av28 = SumN(bp, period=self.p.p3) / SumN(tr, period=self.p.p3)

        uo = 100.0 * (4.0 * av7 + 2.0 * av14 + av28) / (4.0 + 2.0 + 1.0)
        self.lines.uo = uo
实时数据/实时交易
原文:
www.backtrader.com/blog/posts/2016-06-21-livedata-feed/live-data-feed/
从版本1.5.0开始,backtrader 支持实时数据源和实时交易。第一个集成实体是:
- 交互经纪人
这是平台创意最初设定的长期目标。设计理念已被证明足够灵活,以适应所需的变化。同时保持相同的界面,这意味着:一次回测,多次交易。相同的代码/api/基本元素/通知用于回测和实时数据提供/交易。
将平台命名为back + trader是有意义的,尽管它本来可以保持纯粹的回测。但不再是。
有什么新变化:
-
存储概念是为像交互经纪人这样一次性提供数据和经纪设施的实体提供一个集成的概念
-
从存储和/或数据源向策略和/或大脑发送新通知
-
时间管理支持...因为一个人可能会从任何地方交易纽约的产品,时间必须保持一致
-
努力在重采样/重播上尽快交付条形图,或者如果市场没有交易,则不要太晚(没有人希望在 30 秒后收到 5 秒重采样的条形图,因为没有中间的 ticks)
-
当然有许多小的内部变化
已经进行了大量的集成测试,并且一个名为ibtest的大样本已经集成在源代码中,但由于这是第 1 个版本,仍可能存在一些边缘情况。如果您决定尝试一下,请执行第 1 个针对交互经纪人提供的模拟交易账户(通常在端口7497而不是7496上运行)。
注意
请确保对与数据断开连接相关的固有风险感到舒适,软件中存在的错误(TWS和backtrader),您自己软件中的错误并监控您的活动。
backtrader不会对交易者可能遭受的任何损失负责(它也不会分担任何盈利)
交互经纪人支持什么:
-
指数(显然不用于交易),股票,期货,期权,期货期权和外汇
-
在连接开始和重新连接后进行回填
-
通知从实时到回填和反之的变化
-
backtrader中已经存在的订单类型:
市价,限价,止损限价和收盘(又称收盘市价)
平台的意图不是重新发明轮子,因此需要/可选使用交互经纪人设施:
-
必需:
IbPy与交互经纪人的 TWS进行接口IB的文档指示如何安装它,如果尚未成为您的武器库的一部分
-
可选:
pytz以自动设置产品的时区。最终用户可以直接将其他
tzinfo兼容的实例(来自pytz或自制的)作为数据源的参数,而不是依赖于自动确定。请参阅文档中的时间管理和文档的IB特定部分。
!!! 注意
 If no `pytz` is detected and no `tzinfo` compatible instance is
  supplied to the *data feed*, the time delivered by the platform will be
  `UTC
尽可能多地进行了文档记录,并且可以在通常的文档链接中找到:
从示例ibtest对TWS Demo进行了几次运行。
首先:对TWTR进行重新采样为 5 秒:
$ ./ibtest.py --port 7497 --data0 TWTR --resample --timeframe Seconds --compression 5
输出:
Server Version: 76
TWS Time at connection:20160620 22:37:37 CET
--------------------------------------------------
Strategy Created
--------------------------------------------------
Timezone from ContractDetails: EST5EDT
Datetime, Open, High, Low, Close, Volume, OpenInterest, SMA
***** STORE NOTIF: <error id=-1, errorCode=2104, errorMsg=Market data farm connection is OK:ibdemo>
***** STORE NOTIF: <error id=-1, errorCode=2106, errorMsg=HMDS data farm connection is OK:demohmds>
***** DATA NOTIF: CONNECTED
0001, 2016-06-20T14:37:35.000000, 15.96, 15.97, 15.96, 15.96, 0.0, 0, nan
***** DATA NOTIF: DELAYED
0002, 2016-06-20T14:37:40.000000, 15.96, 15.97, 15.96, 15.96, 0.0, 0, nan
0003, 2016-06-20T14:37:45.000000, 15.96, 15.97, 15.96, 15.97, 0.0, 0, nan
0004, 2016-06-20T14:37:50.000000, 15.96, 15.98, 15.94, 15.94, 0.0, 0, nan
0005, 2016-06-20T14:37:55.000000, 15.97, 15.97, 15.96, 15.97, 0.0, 0, 15.96
...
1441, 2016-06-20T16:37:35.000000, 16.03, 16.03, 16.02, 16.03, 0.0, 0, 16.026
1442, 2016-06-20T16:37:40.000000, 16.11, 16.11, 16.11, 16.11, 2.0, 0, 16.044
***** DATA NOTIF: LIVE
1443, 2016-06-20T16:37:45.000000, 16.1, 16.11, 16.1, 16.11, 5.0, 0, 16.06
1444, 2016-06-20T16:37:50.000000, 16.11, 16.11, 16.1, 16.1, 14.0, 0, 16.076
...
注意
执行环境安装了pytz。
以下情况可观察到:
-
第 1 行(来自
IbPy本身)显示连接到服务器已成功,数据源已经确定了资产的操作时区:EST5EDT(又称EST又称US/Eastern)。注意TWS在开头报告的本地时间(在时区
CET又称Europe/Berlin),但资产落后6小时。资产报告在交易场所的时间。如果你认为你真的想要改变这个,并且有关这种行为的理由,请查阅文档。
-
一些来自Store的通知,在这种情况下,TWS表示与不同数据中心的连接正常。这是通过Strategy中重写的方法打印出来的。
-
数据通知,比如:
-
CONNECTED:告知策略连接到TWS可用。 -
DELAYED:接收到的数据不是实时数据。正在进行回补(历史数据)。因为重新采样参数为秒/5,所以单个请求中可以下载的 5 秒条的最大数量大约为 1440。
-
LIVE:一旦平台赶上回补,并且队列减少到实时数据,通知会告知策略。从条 1443 开始,数据是实时数据。
注意
因为正在进行重新采样,这些数据不是 tick 数据,并且会在 5 秒周期结束时传递。请查看
IBData中qcheck参数文档,了解重新采样条会因为平台没有发送新的 tick 而延迟多快(因为没有新的 tick,平台无法确定当前重新采样的条是否已经结束)。
-
让我们做同样的事情,但强制断开连接(网络接口被禁用了 20 秒):
$ ./ibtest.py --port 7497 --data0 TWTR --resample --timeframe Seconds --compression 5
输出(跳过初始已知部分):
...
1440, 2016-06-20T18:16:20.000000, 16.05, 16.05, 16.04, 16.04, 0.0, 0, 16.048
1441, 2016-06-20T18:16:25.000000, 16.05, 16.05, 16.05, 16.05, 0.0, 0, 16.05
***** DATA NOTIF: LIVE
1442, 2016-06-20T18:16:30.000000, 15.9, 15.9, 15.89, 15.9, 11.0, 0, 16.02
***** STORE NOTIF: <error id=-1, errorCode=1100, errorMsg=Connectivity between IB and TWS has been lost.>
***** STORE NOTIF: <error id=-1, errorCode=2105, errorMsg=HMDS data farm connection is broken:demohmds>
***** STORE NOTIF: <error id=-1, errorCode=2103, errorMsg=Market data farm connection is broken:ibdemo>
1443, 2016-06-20T18:16:35.000000, 15.9, 15.9, 15.89, 15.9, 28.0, 0, 15.988
***** STORE NOTIF: <error id=-1, errorCode=1102, errorMsg=Connectivity between IB and TWS has been restored - data maintained.>
***** STORE NOTIF: <error id=-1, errorCode=2106, errorMsg=HMDS data farm connection is OK:demohmds>
***** STORE NOTIF: <error id=-1, errorCode=2104, errorMsg=Market data farm connection is OK:ibdemo>
***** DATA NOTIF: DELAYED
1444, 2016-06-20T18:16:40.000000, 16.04, 16.04, 16.03, 16.04, 0.0, 0, 15.986
1445, 2016-06-20T18:16:45.000000, 16.03, 16.04, 16.03, 16.04, 0.0, 0, 15.986
1446, 2016-06-20T18:16:50.000000, 16.04, 16.04, 16.03, 16.03, 0.0, 0, 15.982
1447, 2016-06-20T18:16:55.000000, 16.04, 16.04, 16.03, 16.04, 0.0, 0, 16.01
1448, 2016-06-20T18:17:00.000000, 16.03, 16.04, 16.03, 16.04, 0.0, 0, 16.038
1449, 2016-06-20T18:17:05.000000, 16.03, 16.04, 16.02, 16.03, 0.0, 0, 16.036
1450, 2016-06-20T18:17:10.000000, 15.9, 15.91, 15.9, 15.91, 3.0, 0, 16.01
***** DATA NOTIF: LIVE
1451, 2016-06-20T18:17:15.000000, 15.92, 15.92, 15.9, 15.92, 9.0, 0, 15.988
1452, 2016-06-20T18:17:20.000000, 15.91, 15.91, 15.89, 15.89, 18.0, 0, 15.958
1453, 2016-06-20T18:17:25.000000, 15.89, 15.92, 15.89, 15.89, 24.0, 0, 15.928
...
叙述:
-
在条 1442 之后,WLAN 接口已被禁用。
-
TWS 通知到达,指示情况。
-
条 1443 是从重新采样器中提取的,因为平台在
18:16:30.000000和18:16:35.000000之间有一些 tick。 -
连接在大约
18:17:15恢复,但此数据不是立即传递的。 -
发现情况,并尝试在
18:16:35和18:17:15之间进行回补。这可以通过通知
DELAYED看到。数据不再是LIVE。 -
条 1444 至 1450(包括两端)提供了缺失的时间。
-
收到通知
LIVE,且条 1451 包含实时数据包。
注意
由于TWS不强制执行,因此存在一些情况,backtrader无法克服。 如果 TCP/IP 数据包某种方式丢失且IB服务器反应迟缓,TWS将花费很长时间来做出反应并通知连接丢失。
TWS甚至会传送清晰接收延迟的数据包,带有当前时间戳(通过突然爆发的数据包识别)
最后一些交易,用单个Market订单购买20K股的TWTR,并将它们分为 2 个10K的订单。
执行:
./ibtest.py --port 7497 --data0 TWTR --resample --timeframe Seconds --compression 5 --broker --trade --stake 20000
输出相当冗长,显示了订单执行的所有部分。总结一下:
...
***** DATA NOTIF: LIVE
1442, 2016-06-20T18:28:05.000000, 15.92, 15.93, 15.92, 15.93, 1748.0, 0, 16.03
-------------------------------------------------- ORDER BEGIN 2016-06-20 23:28:11.343000
Ref: 1
OrdType: 0
OrdType: Buy
Status: 1
Status: Submitted
Size: 20000
Price: 14.34
Price Limit: None
ExecType: 0
ExecType: Market
CommInfo: <backtrader.brokers.ibbroker.IBCommInfo object at 0x00000000040B9278>
End of Session: 736136.166655
Info: AutoOrderedDict()
Broker: <backtrader.brokers.ibbroker.IBBroker object at 0x0000000003E23470>
Alive: True
Ref: 1
orderId: 1
Action: BUY
Size (ib): 20000
Lmt Price: 0.0
Aux Price: 0.0
OrderType: MKT
Tif (Time in Force): GTC
GoodTillDate:
-------------------------------------------------- ORDER END
...
1443, 2016-06-20T18:28:10.000000, 15.93, 15.93, 15.92, 15.92, 10.0, 0, 16.004
-------------------------------------------------- ORDER BEGIN 2016-06-20 23:28:15.924000
Ref: 1
OrdType: 0
OrdType: Buy
Status: 3
Status: Partial
Size: 20000
Price: 14.34
Price Limit: None
ExecType: 0
ExecType: Market
CommInfo: <backtrader.brokers.ibbroker.IBCommInfo object at 0x00000000040B9278>
End of Session: 736136.166655
Info: AutoOrderedDict()
Broker: <backtrader.brokers.ibbroker.IBBroker object at 0x0000000003E23470>
Alive: True
Ref: 1
orderId: 1
Action: BUY
Size (ib): 20000
Lmt Price: 0.0
Aux Price: 0.0
OrderType: MKT
Tif (Time in Force): GTC
GoodTillDate:
-------------------------------------------------- ORDER END
...
-------------------------------------------------- ORDER BEGIN 2016-06-20 23:28:20.972000
Ref: 1
OrdType: 0
OrdType: Buy
Status: 4
Status: Completed
Size: 20000
Price: 14.34
Price Limit: None
ExecType: 0
ExecType: Market
CommInfo: <backtrader.brokers.ibbroker.IBCommInfo object at 0x00000000040B9278>
End of Session: 736136.166655
Info: AutoOrderedDict()
Broker: <backtrader.brokers.ibbroker.IBBroker object at 0x0000000003E23470>
Alive: False
Ref: 1
orderId: 1
Action: BUY
Size (ib): 20000
Lmt Price: 0.0
Aux Price: 0.0
OrderType: MKT
Tif (Time in Force): GTC
GoodTillDate:
-------------------------------------------------- ORDER END
1445, 2016-06-20T18:28:20.000000, 15.92, 15.93, 15.92, 15.93, 21.0, 0, 15.954
...
发生了以下情况:
-
数据正常接收
-
发出了一个执行类型为
Market的BUY20K-
收到
Submitted和Accepted通知(仅显示了Submitted) -
一连串的
Partial执行(仅显示了 1 个),直到收到Completed。
实际执行未显示,但可在收到的
order实例下的order.executed中找到 -
-
虽然未显示,但发出了 2 个
MarketSELL订单以撤消操作屏幕截图显示了在一个晚上进行两次不同运行后TWS中的日志
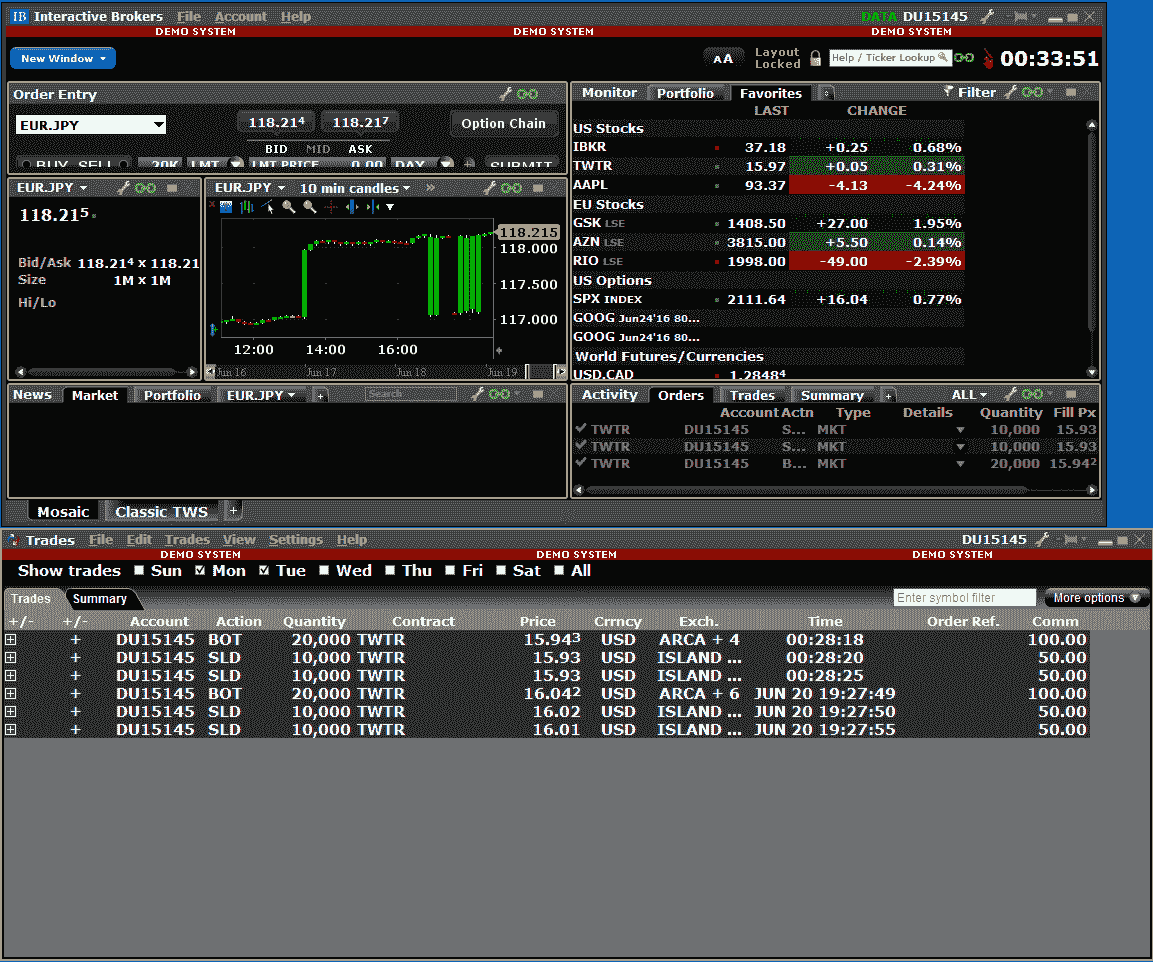
示例可以做更多,并且旨在对设施进行彻底测试,如果可能的话发现任何问题。
用法:
$ ./ibtest.py --help
usage: ibtest.py [-h] [--exactbars EXACTBARS] [--plot] [--stopafter STOPAFTER]
                 [--usestore] [--notifyall] [--debug] [--host HOST]
                 [--qcheck QCHECK] [--port PORT] [--clientId CLIENTID]
                 [--no-timeoffset] [--reconnect RECONNECT] [--timeout TIMEOUT]
                 --data0 DATA0 [--data1 DATA1] [--timezone TIMEZONE]
                 [--what WHAT] [--no-backfill_start] [--latethrough]
                 [--no-backfill] [--rtbar] [--historical]
                 [--fromdate FROMDATE] [--smaperiod SMAPERIOD]
                 [--replay | --resample]
                 [--timeframe {Ticks,MicroSeconds,Seconds,Minutes,Days,Weeks,Months,Years}]
                 [--compression COMPRESSION] [--no-takelate] [--no-bar2edge]
                 [--no-adjbartime] [--no-rightedge] [--broker] [--trade]
                 [--donotsell]
                 [--exectype {Market,Close,Limit,Stop,StopLimit}]
                 [--stake STAKE] [--valid VALID] [--cancel CANCEL]

Test Interactive Brokers integration

optional arguments:
  -h, --help            show this help message and exit
  --exactbars EXACTBARS
                        exactbars level, use 0/-1/-2 to enable plotting
                        (default: 1)
  --plot                Plot if possible (default: False)
  --stopafter STOPAFTER
                        Stop after x lines of LIVE data (default: 0)
  --usestore            Use the store pattern (default: False)
  --notifyall           Notify all messages to strategy as store notifs
                        (default: False)
  --debug               Display all info received form IB (default: False)
  --host HOST           Host for the Interactive Brokers TWS Connection
                        (default: 127.0.0.1)
  --qcheck QCHECK       Timeout for periodic notification/resampling/replaying
                        check (default: 0.5)
  --port PORT           Port for the Interactive Brokers TWS Connection
                        (default: 7496)
  --clientId CLIENTID   Client Id to connect to TWS (default: random)
                        (default: None)
  --no-timeoffset       Do not Use TWS/System time offset for non timestamped
                        prices and to align resampling (default: False)
  --reconnect RECONNECT
                        Number of recconnection attempts to TWS (default: 3)
  --timeout TIMEOUT     Timeout between reconnection attempts to TWS (default:
                        3.0)
  --data0 DATA0         data 0 into the system (default: None)
  --data1 DATA1         data 1 into the system (default: None)
  --timezone TIMEZONE   timezone to get time output into (pytz names)
                        (default: None)
  --what WHAT           specific price type for historical requests (default:
                        None)
  --no-backfill_start   Disable backfilling at the start (default: False)
  --latethrough         if resampling replaying, adjusting time and disabling
                        time offset, let late samples through (default: False)
  --no-backfill         Disable backfilling after a disconnection (default:
                        False)
  --rtbar               Use 5 seconds real time bar updates if possible
                        (default: False)
  --historical          do only historical download (default: False)
  --fromdate FROMDATE   Starting date for historical download with format:
                        YYYY-MM-DD[THH:MM:SS] (default: None)
  --smaperiod SMAPERIOD
                        Period to apply to the Simple Moving Average (default:
                        5)
  --replay              replay to chosen timeframe (default: False)
  --resample            resample to chosen timeframe (default: False)
  --timeframe {Ticks,MicroSeconds,Seconds,Minutes,Days,Weeks,Months,Years}
                        TimeFrame for Resample/Replay (default: Ticks)
  --compression COMPRESSION
                        Compression for Resample/Replay (default: 1)
  --no-takelate         resample/replay, do not accept late samples in new bar
                        if the data source let them through (latethrough)
                        (default: False)
  --no-bar2edge         no bar2edge for resample/replay (default: False)
  --no-adjbartime       no adjbartime for resample/replay (default: False)
  --no-rightedge        no rightedge for resample/replay (default: False)
  --broker              Use IB as broker (default: False)
  --trade               Do Sample Buy/Sell operations (default: False)
  --donotsell           Do not sell after a buy (default: False)
  --exectype {Market,Close,Limit,Stop,StopLimit}
                        Execution to Use when opening position (default:
                        Market)
  --stake STAKE         Stake to use in buy operations (default: 10)
  --valid VALID         Seconds to keep the order alive (0 means DAY)
                        (default: None)
  --cancel CANCEL       Cancel a buy order after n bars in operation, to be
                        combined with orders like Limit (default: 0)
代码:
from __future__ import (absolute_import, division, print_function,
                        unicode_literals)

import argparse
import datetime

# The above could be sent to an independent module
import backtrader as bt
from backtrader.utils import flushfile  # win32 quick stdout flushing

class TestStrategy(bt.Strategy):
    params = dict(
        smaperiod=5,
        trade=False,
        stake=10,
        exectype=bt.Order.Market,
        stopafter=0,
        valid=None,
        cancel=0,
        donotsell=False,
    )

    def __init__(self):
        # To control operation entries
        self.orderid = list()
        self.order = None

        self.counttostop = 0
        self.datastatus = 0

        # Create SMA on 2nd data
        self.sma = bt.indicators.MovAv.SMA(self.data, period=self.p.smaperiod)

        print('--------------------------------------------------')
        print('Strategy Created')
        print('--------------------------------------------------')

    def notify_data(self, data, status, *args, **kwargs):
        print('*' * 5, 'DATA NOTIF:', data._getstatusname(status), *args)
        if status == data.LIVE:
            self.counttostop = self.p.stopafter
            self.datastatus = 1

    def notify_store(self, msg, *args, **kwargs):
        print('*' * 5, 'STORE NOTIF:', msg)

    def notify_order(self, order):
        if order.status in [order.Completed, order.Cancelled, order.Rejected]:
            self.order = None

        print('-' * 50, 'ORDER BEGIN', datetime.datetime.now())
        print(order)
        print('-' * 50, 'ORDER END')

    def notify_trade(self, trade):
        print('-' * 50, 'TRADE BEGIN', datetime.datetime.now())
        print(trade)
        print('-' * 50, 'TRADE END')

    def prenext(self):
        self.next(frompre=True)

    def next(self, frompre=False):
        txt = list()
        txt.append('%04d' % len(self))
        dtfmt = '%Y-%m-%dT%H:%M:%S.%f'
        txt.append('%s' % self.data.datetime.datetime(0).strftime(dtfmt))
        txt.append('{}'.format(self.data.open[0]))
        txt.append('{}'.format(self.data.high[0]))
        txt.append('{}'.format(self.data.low[0]))
        txt.append('{}'.format(self.data.close[0]))
        txt.append('{}'.format(self.data.volume[0]))
        txt.append('{}'.format(self.data.openinterest[0]))
        txt.append('{}'.format(self.sma[0]))
        print(', '.join(txt))

        if len(self.datas) > 1:
            txt = list()
            txt.append('%04d' % len(self))
            dtfmt = '%Y-%m-%dT%H:%M:%S.%f'
            txt.append('%s' % self.data1.datetime.datetime(0).strftime(dtfmt))
            txt.append('{}'.format(self.data1.open[0]))
            txt.append('{}'.format(self.data1.high[0]))
            txt.append('{}'.format(self.data1.low[0]))
            txt.append('{}'.format(self.data1.close[0]))
            txt.append('{}'.format(self.data1.volume[0]))
            txt.append('{}'.format(self.data1.openinterest[0]))
            txt.append('{}'.format(float('NaN')))
            print(', '.join(txt))

        if self.counttostop:  # stop after x live lines
            self.counttostop -= 1
            if not self.counttostop:
                self.env.runstop()
                return

        if not self.p.trade:
            return

        if self.datastatus and not self.position and len(self.orderid) < 1:
            self.order = self.buy(size=self.p.stake,
                                  exectype=self.p.exectype,
                                  price=round(self.data0.close[0] * 0.90, 2),
                                  valid=self.p.valid)

            self.orderid.append(self.order)
        elif self.position.size > 0 and not self.p.donotsell:
            if self.order is None:
                self.order = self.sell(size=self.p.stake // 2,
                                       exectype=bt.Order.Market,
                                       price=self.data0.close[0])

        elif self.order is not None and self.p.cancel:
            if self.datastatus > self.p.cancel:
                self.cancel(self.order)

        if self.datastatus:
            self.datastatus += 1

    def start(self):
        if self.data0.contractdetails is not None:
            print('Timezone from ContractDetails: {}'.format(
                  self.data0.contractdetails.m_timeZoneId))

        header = ['Datetime', 'Open', 'High', 'Low', 'Close', 'Volume',
                  'OpenInterest', 'SMA']
        print(', '.join(header))

        self.done = False

def runstrategy():
    args = parse_args()

    # Create a cerebro
    cerebro = bt.Cerebro()

    storekwargs = dict(
        host=args.host, port=args.port,
        clientId=args.clientId, timeoffset=not args.no_timeoffset,
        reconnect=args.reconnect, timeout=args.timeout,
        notifyall=args.notifyall, _debug=args.debug
    )

    if args.usestore:
        ibstore = bt.stores.IBStore(**storekwargs)

    if args.broker:
        if args.usestore:
            broker = ibstore.getbroker()
        else:
            broker = bt.brokers.IBBroker(**storekwargs)

        cerebro.setbroker(broker)

    timeframe = bt.TimeFrame.TFrame(args.timeframe)
    if args.resample or args.replay:
        datatf = bt.TimeFrame.Ticks
        datacomp = 1
    else:
        datatf = timeframe
        datacomp = args.compression

    fromdate = None
    if args.fromdate:
        dtformat = '%Y-%m-%d' + ('T%H:%M:%S' * ('T' in args.fromdate))
        fromdate = datetime.datetime.strptime(args.fromdate, dtformat)

    IBDataFactory = ibstore.getdata if args.usestore else bt.feeds.IBData

    datakwargs = dict(
        timeframe=datatf, compression=datacomp,
        historical=args.historical, fromdate=fromdate,
        rtbar=args.rtbar,
        qcheck=args.qcheck,
        what=args.what,
        backfill_start=not args.no_backfill_start,
        backfill=not args.no_backfill,
        latethrough=args.latethrough,
        tz=args.timezone
    )

    if not args.usestore and not args.broker:   # neither store nor broker
        datakwargs.update(storekwargs)  # pass the store args over the data

    data0 = IBDataFactory(dataname=args.data0, **datakwargs)

    data1 = None
    if args.data1 is not None:
        data1 = IBDataFactory(dataname=args.data1, **datakwargs)

    rekwargs = dict(
        timeframe=timeframe, compression=args.compression,
        bar2edge=not args.no_bar2edge,
        adjbartime=not args.no_adjbartime,
        rightedge=not args.no_rightedge,
        takelate=not args.no_takelate,
    )

    if args.replay:
        cerebro.replaydata(dataname=data0, **rekwargs)

        if data1 is not None:
            cerebro.replaydata(dataname=data1, **rekwargs)

    elif args.resample:
        cerebro.resampledata(dataname=data0, **rekwargs)

        if data1 is not None:
            cerebro.resampledata(dataname=data1, **rekwargs)

    else:
        cerebro.adddata(data0)
        if data1 is not None:
            cerebro.adddata(data1)

    if args.valid is None:
        valid = None
    else:
        datetime.timedelta(seconds=args.valid)
    # Add the strategy
    cerebro.addstrategy(TestStrategy,
                        smaperiod=args.smaperiod,
                        trade=args.trade,
                        exectype=bt.Order.ExecType(args.exectype),
                        stake=args.stake,
                        stopafter=args.stopafter,
                        valid=valid,
                        cancel=args.cancel,
                        donotsell=args.donotsell)

    # Live data ... avoid long data accumulation by switching to "exactbars"
    cerebro.run(exactbars=args.exactbars)

    if args.plot and args.exactbars < 1:  # plot if possible
        cerebro.plot()

def parse_args():
    parser = argparse.ArgumentParser(
        formatter_class=argparse.ArgumentDefaultsHelpFormatter,
        description='Test Interactive Brokers integration')

    parser.add_argument('--exactbars', default=1, type=int,
                        required=False, action='store',
                        help='exactbars level, use 0/-1/-2 to enable plotting')

    parser.add_argument('--plot',
                        required=False, action='store_true',
                        help='Plot if possible')

    parser.add_argument('--stopafter', default=0, type=int,
                        required=False, action='store',
                        help='Stop after x lines of LIVE data')

    parser.add_argument('--usestore',
                        required=False, action='store_true',
                        help='Use the store pattern')

    parser.add_argument('--notifyall',
                        required=False, action='store_true',
                        help='Notify all messages to strategy as store notifs')

    parser.add_argument('--debug',
                        required=False, action='store_true',
                        help='Display all info received form IB')

    parser.add_argument('--host', default='127.0.0.1',
                        required=False, action='store',
                        help='Host for the Interactive Brokers TWS Connection')

    parser.add_argument('--qcheck', default=0.5, type=float,
                        required=False, action='store',
                        help=('Timeout for periodic '
                              'notification/resampling/replaying check'))

    parser.add_argument('--port', default=7496, type=int,
                        required=False, action='store',
                        help='Port for the Interactive Brokers TWS Connection')

    parser.add_argument('--clientId', default=None, type=int,
                        required=False, action='store',
                        help='Client Id to connect to TWS (default: random)')

    parser.add_argument('--no-timeoffset',
                        required=False, action='store_true',
                        help=('Do not Use TWS/System time offset for non '
                              'timestamped prices and to align resampling'))

    parser.add_argument('--reconnect', default=3, type=int,
                        required=False, action='store',
                        help='Number of recconnection attempts to TWS')

    parser.add_argument('--timeout', default=3.0, type=float,
                        required=False, action='store',
                        help='Timeout between reconnection attempts to TWS')

    parser.add_argument('--data0', default=None,
                        required=True, action='store',
                        help='data 0 into the system')

    parser.add_argument('--data1', default=None,
                        required=False, action='store',
                        help='data 1 into the system')

    parser.add_argument('--timezone', default=None,
                        required=False, action='store',
                        help='timezone to get time output into (pytz names)')

    parser.add_argument('--what', default=None,
                        required=False, action='store',
                        help='specific price type for historical requests')

    parser.add_argument('--no-backfill_start',
                        required=False, action='store_true',
                        help='Disable backfilling at the start')

    parser.add_argument('--latethrough',
                        required=False, action='store_true',
                        help=('if resampling replaying, adjusting time '
                              'and disabling time offset, let late samples '
                              'through'))

    parser.add_argument('--no-backfill',
                        required=False, action='store_true',
                        help='Disable backfilling after a disconnection')

    parser.add_argument('--rtbar', default=False,
                        required=False, action='store_true',
                        help='Use 5 seconds real time bar updates if possible')

    parser.add_argument('--historical',
                        required=False, action='store_true',
                        help='do only historical download')

    parser.add_argument('--fromdate',
                        required=False, action='store',
                        help=('Starting date for historical download '
                              'with format: YYYY-MM-DD[THH:MM:SS]'))

    parser.add_argument('--smaperiod', default=5, type=int,
                        required=False, action='store',
                        help='Period to apply to the Simple Moving Average')

    pgroup = parser.add_mutually_exclusive_group(required=False)

    pgroup.add_argument('--replay',
                        required=False, action='store_true',
                        help='replay to chosen timeframe')

    pgroup.add_argument('--resample',
                        required=False, action='store_true',
                        help='resample to chosen timeframe')

    parser.add_argument('--timeframe', default=bt.TimeFrame.Names[0],
                        choices=bt.TimeFrame.Names,
                        required=False, action='store',
                        help='TimeFrame for Resample/Replay')

    parser.add_argument('--compression', default=1, type=int,
                        required=False, action='store',
                        help='Compression for Resample/Replay')

    parser.add_argument('--no-takelate',
                        required=False, action='store_true',
                        help=('resample/replay, do not accept late samples '
                              'in new bar if the data source let them through '
                              '(latethrough)'))

    parser.add_argument('--no-bar2edge',
                        required=False, action='store_true',
                        help='no bar2edge for resample/replay')

    parser.add_argument('--no-adjbartime',
                        required=False, action='store_true',
                        help='no adjbartime for resample/replay')

    parser.add_argument('--no-rightedge',
                        required=False, action='store_true',
                        help='no rightedge for resample/replay')

    parser.add_argument('--broker',
                        required=False, action='store_true',
                        help='Use IB as broker')

    parser.add_argument('--trade',
                        required=False, action='store_true',
                        help='Do Sample Buy/Sell operations')

    parser.add_argument('--donotsell',
                        required=False, action='store_true',
                        help='Do not sell after a buy')

    parser.add_argument('--exectype', default=bt.Order.ExecTypes[0],
                        choices=bt.Order.ExecTypes,
                        required=False, action='store',
                        help='Execution to Use when opening position')

    parser.add_argument('--stake', default=10, type=int,
                        required=False, action='store',
                        help='Stake to use in buy operations')

    parser.add_argument('--valid', default=None, type=int,
                        required=False, action='store',
                        help='Seconds to keep the order alive (0 means DAY)')

    parser.add_argument('--cancel', default=0, type=int,
                        required=False, action='store',
                        help=('Cancel a buy order after n bars in operation,'
                              ' to be combined with orders like Limit'))

    return parser.parse_args()

if __name__ == '__main__':
    runstrategy()
节省内存
原文:
www.backtrader.com/blog/posts/2016-05-09-memory-savings/memory-savings/
版本 1.3.1.92 已经重新设计并完全实现了之前的内存节省方案,虽然之前并没有被过多宣传和使用。
发布:github.com/mementum/backtrader/releases/tag/1.3.1.92
backtrader在拥有很好内存量的机器上(并将进一步开发)开发,加上通过绘图进行可视化反馈几乎是必需的,这使得设计决策变得容易:将所有内容保存在内存中。
这个决定有一些缺点:
-
array.array用于数据存储,当超过一些边界时必须分配和移动数据 -
具有较少内存的机器可能会受到影响。
-
连接到在线数据源,可以在线运行数周/数月,并将数千秒/分钟的分辨率 tick 送入系统
后者比第一个更重要,因为为backtrader做出了另一个设计决策:
-
需要是纯 Python,以便在需要时在嵌入式系统中运行。
将来的一个场景可能是
backtrader连接到提供实时数据源的第二台机器,而backtrader本身运行在一个树莓派或者甚至更有限的设备上,比如一个 ADSL 路由器(AVM Frit!Box 7490,配备Freetz镜像)。
因此需要backtrader支持动态内存方案。现在可以使用以下语义来实例化或运行Cerebro:
-
exactbars(默认值:False)
默认为
False值时,每个线条中存储的每个值都会保留在内存中。可能的值:
- `True` or `1`: all “lines” objects reduce memory usage to the
  automatically calculated minimum period.

  If a Simple Moving Average has a period of 30, the underlying data
  will have always a running buffer of 30 bars to allow the
  calculation of the Simple Moving Average

  - This setting will deactivate `preload` and `runonce`

  - Using this setting also deactivates **plotting**

- `-1`: datas and indicators/operations at strategy level will keep
  all data in memory.

  For example: a `RSI` internally uses the indicator `UpDay` to
  make calculations. This subindicator will not keep all data in
  memory

  - This allows to keep `plotting` and `preloading` active.

  - `runonce` will be deactivated

- `-2`: datas and indicators kept as attributes of the strategy
  will keep all data in memory.

  For example: a `RSI` internally uses the indicator `UpDay` to
  make calculations. This subindicator will not keep all data in
  memory

  If in the `__init__` something like
  `a = self.data.close - self.data.high` is defined, then `a`
  will not keep all data in memory

  - This allows to keep `plotting` and `preloading` active.

  - `runonce` will be deactivated`
一如既往,例子胜过千言万语。一个样本脚本显示了差异。它针对 1996 年至 2015 年的Yahoo每日数据运行,总计4965天。
注意
这只是一个小样本。每天交易 14 小时的 EuroStoxx50 期货品种,在只有 1 个月的交易中将产生约 18000 个 1 分钟 K 线。
执行第一个脚本以查看在不请求内存节省时使用了多少内存位置:
$ ./memory-savings.py --save 0
Total memory cells used: 506430
对于级别 1(总节省):
$ ./memory-savings.py --save 1
Total memory cells used: 2041
天啊!!!从一百万降至2041。确实。系统中的每个lines对象都使用collections.deque作为缓冲区(而不是array.array)并且被长度边界到请求操作的绝对最小值。例如:
- 在数据源上使用周期为
30的SimpleMovingAverage的策略。
在这种情况下,将进行以下调整:
-
数据源 将有一个
30位置的缓冲区,这是由SimpleMovingAverage产生下一个值所需的量。 -
SimpleMovingAverage将有一个1位置的缓冲区,因为除非被其他指标(依赖移动平均线)需要,否则没有必要保留更大的缓冲区。
注意
这种模式最吸引人且可能最重要的特点是脚本的整个生命周期内使用的内存量保持恒定。
无论数据源的大小如何。
如果长时间连接到实时数据源,这将非常有用。
但要考虑:
-
绘图不可用
-
还有其他会随时间累积的内存消耗源,比如策略生成的
orders。 -
这种模式只能在
cerebro中使用runonce=False。这对于实时数据源是强制的,但在简单的回测中,这比runonce=True慢。肯定存在一个权衡点,即内存管理比逐步执行回测更昂贵,但这只能由平台的最终用户根据具体情况来判断。
现在是负级别。这些级别旨在在保存足够的内存的同时保持绘图可用。第一级别为-1:
$ ./memory-savings.py --save -1
Total memory cells used: 184623
在这种情况下,指标的第一级(在策略中声明的那些)保持其完整长度的缓冲区。但如果这些指标依赖于其他指标(这是情况),以执行其工作,那么子对象将被限制长度。在这种情况下,我们从:
506430个内存位置变为184623个
超过 50%的节省。
注意
当然,array.array对象已被更换为在内存方面更昂贵但在操作方面更快的collections.deque。但collection.deque对象相当小,节省的内存位置大致相等。
现在是第二级,也旨在节省在策略级别声明为不绘制的指标上的内存:
$ ./memory-savings.py --save -2
Total memory cells used: 174695
现在并没有节省太多。这是因为一个单独的指标被标记为不绘制:TestInd().plotinfo.plot = False
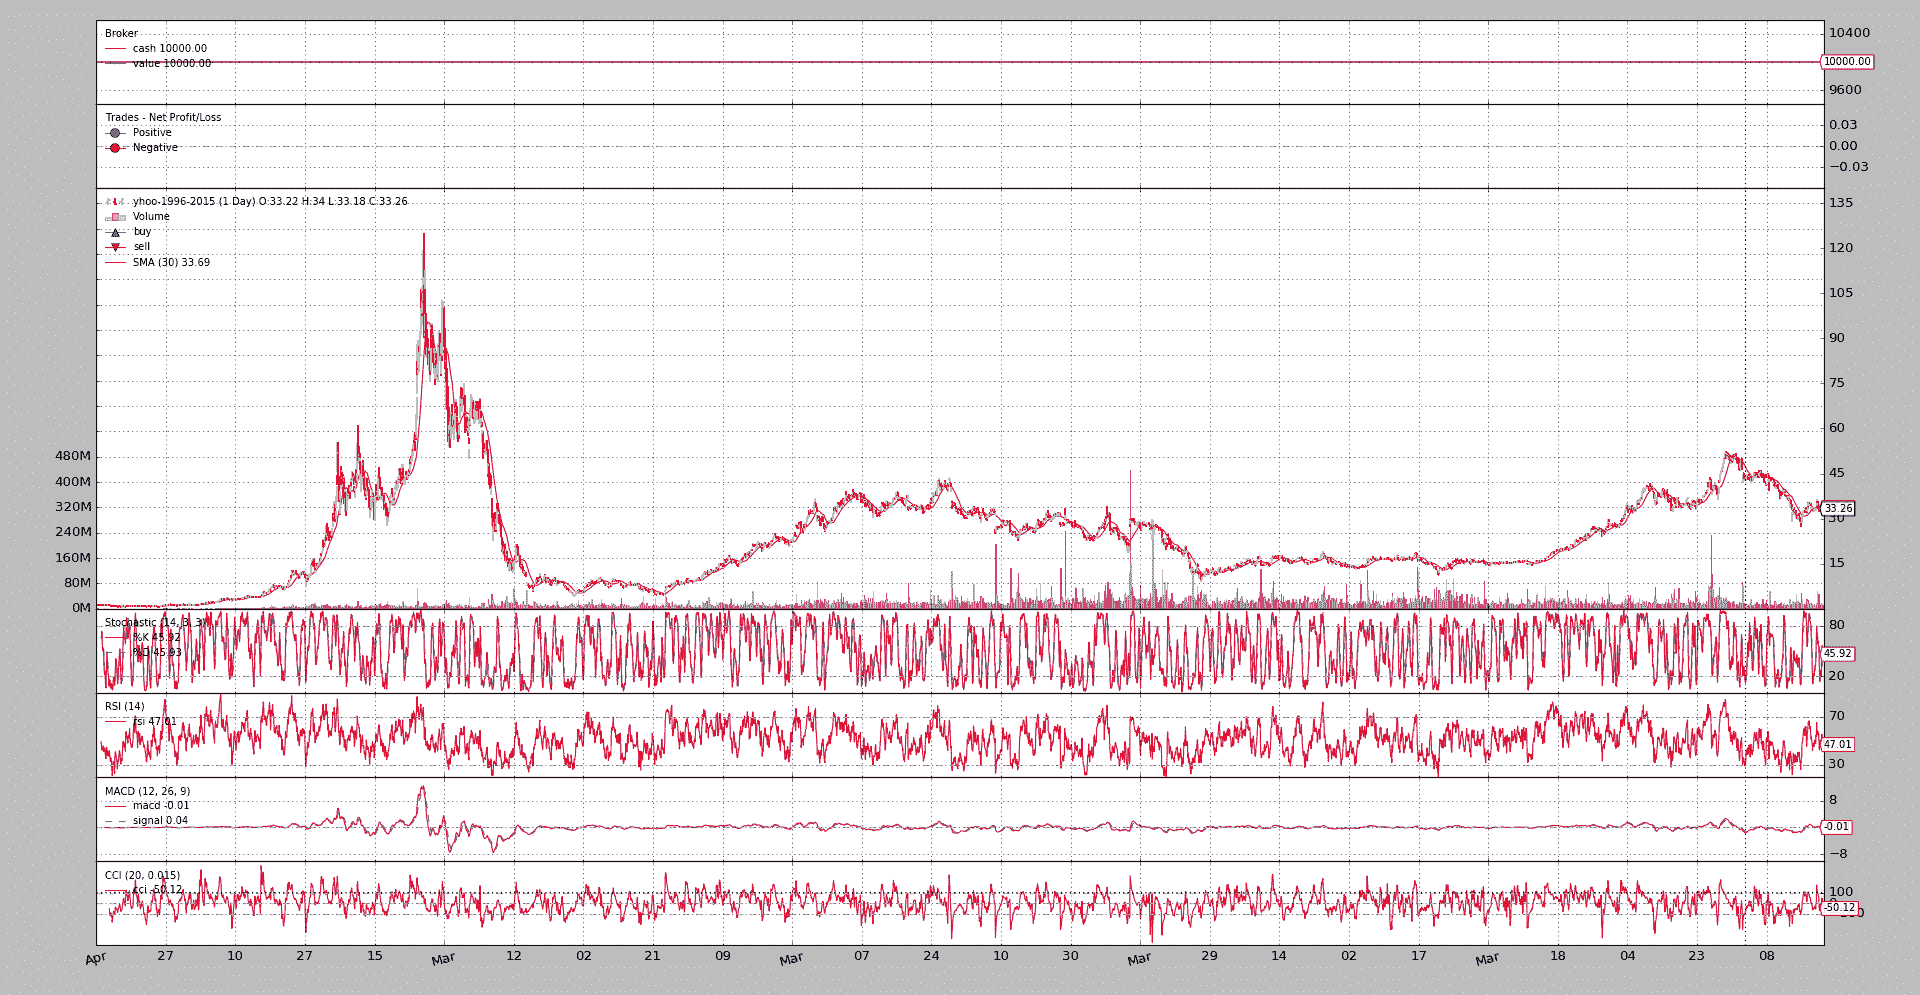
让我们看看最后一个示例的绘图:
$ ./memory-savings.py --save -2 --plot
Total memory cells used: 174695
对于感兴趣的读者,示例脚本可以生成对指标层次结构中遍历的每个lines对象的详细分析。运行时启用绘图(保存在-1处):
$ ./memory-savings.py --save -1 --lendetails
-- Evaluating Datas
---- Data 0 Total Cells 34755 - Cells per Line 4965
-- Evaluating Indicators
---- Indicator 1.0 Average Total Cells 30 - Cells per line 30
---- SubIndicators Total Cells 1
---- Indicator 1.1 _LineDelay Total Cells 1 - Cells per line 1
---- SubIndicators Total Cells 1
...
---- Indicator 0.5 TestInd Total Cells 9930 - Cells per line 4965
---- SubIndicators Total Cells 0
-- Evaluating Observers
---- Observer 0 Total Cells 9930 - Cells per Line 4965
---- Observer 1 Total Cells 9930 - Cells per Line 4965
---- Observer 2 Total Cells 9930 - Cells per Line 4965
Total memory cells used: 184623
启用最大节省(1)的相同代码:
$ ./memory-savings.py --save 1 --lendetails
-- Evaluating Datas
---- Data 0 Total Cells 266 - Cells per Line 38
-- Evaluating Indicators
---- Indicator 1.0 Average Total Cells 30 - Cells per line 30
---- SubIndicators Total Cells 1
...
---- Indicator 0.5 TestInd Total Cells 2 - Cells per line 1
---- SubIndicators Total Cells 0
-- Evaluating Observers
---- Observer 0 Total Cells 2 - Cells per Line 1
---- Observer 1 Total Cells 2 - Cells per Line 1
---- Observer 2 Total Cells 2 - Cells per Line 1
第二个输出立即显示了数据源中的行数被限制为38个内存位置,而不是完整数据源长度的4965个。
并且指标和观察者在可能的情况下被限制为1,如输出的最后几行所示。
脚本代码和用法
在backtrader源代码中作为示例提供。用法:
$ ./memory-savings.py --help
usage: memory-savings.py [-h] [--data DATA] [--save SAVE] [--datalines]
                         [--lendetails] [--plot]

Check Memory Savings

optional arguments:
  -h, --help    show this help message and exit
  --data DATA   Data to be read in (default: ../../datas/yhoo-1996-2015.txt)
  --save SAVE   Memory saving level [1, 0, -1, -2] (default: 0)
  --datalines   Print data lines (default: False)
  --lendetails  Print individual items memory usage (default: False)
  --plot        Plot the result (default: False)
代码:
from __future__ import (absolute_import, division, print_function,
                        unicode_literals)

import argparse
import sys

import backtrader as bt
import backtrader.feeds as btfeeds
import backtrader.indicators as btind
import backtrader.utils.flushfile

class TestInd(bt.Indicator):
    lines = ('a', 'b')

    def __init__(self):
        self.lines.a = b = self.data.close - self.data.high
        self.lines.b = btind.SMA(b, period=20)

class St(bt.Strategy):
    params = (
        ('datalines', False),
        ('lendetails', False),
    )

    def __init__(self):
        btind.SMA()
        btind.Stochastic()
        btind.RSI()
        btind.MACD()
        btind.CCI()
        TestInd().plotinfo.plot = False

    def next(self):
        if self.p.datalines:
            txt = ','.join(
                ['%04d' % len(self),
                 '%04d' % len(self.data0),
                 self.data.datetime.date(0).isoformat()]
            )

            print(txt)

    def loglendetails(self, msg):
        if self.p.lendetails:
            print(msg)

    def stop(self):
        super(St, self).stop()

        tlen = 0
        self.loglendetails('-- Evaluating Datas')
        for i, data in enumerate(self.datas):
            tdata = 0
            for line in data.lines:
                tdata += len(line.array)
                tline = len(line.array)

            tlen += tdata
            logtxt = '---- Data {} Total Cells {} - Cells per Line {}'
            self.loglendetails(logtxt.format(i, tdata, tline))

        self.loglendetails('-- Evaluating Indicators')
        for i, ind in enumerate(self.getindicators()):
            tlen += self.rindicator(ind, i, 0)

        self.loglendetails('-- Evaluating Observers')
        for i, obs in enumerate(self.getobservers()):
            tobs = 0
            for line in obs.lines:
                tobs += len(line.array)
                tline = len(line.array)

            tlen += tdata
            logtxt = '---- Observer {} Total Cells {} - Cells per Line {}'
            self.loglendetails(logtxt.format(i, tobs, tline))

        print('Total memory cells used: {}'.format(tlen))

    def rindicator(self, ind, i, deep):
        tind = 0
        for line in ind.lines:
            tind += len(line.array)
            tline = len(line.array)

        thisind = tind

        tsub = 0
        for j, sind in enumerate(ind.getindicators()):
            tsub += self.rindicator(sind, j, deep + 1)

        iname = ind.__class__.__name__.split('.')[-1]

        logtxt = '---- Indicator {}.{} {} Total Cells {} - Cells per line {}'
        self.loglendetails(logtxt.format(deep, i, iname, tind, tline))
        logtxt = '---- SubIndicators Total Cells {}'
        self.loglendetails(logtxt.format(deep, i, iname, tsub))

        return tind + tsub

def runstrat():
    args = parse_args()

    cerebro = bt.Cerebro()
    data = btfeeds.YahooFinanceCSVData(dataname=args.data)
    cerebro.adddata(data)
    cerebro.addstrategy(
        St, datalines=args.datalines, lendetails=args.lendetails)

    cerebro.run(runonce=False, exactbars=args.save)
    if args.plot:
        cerebro.plot(style='bar')

def parse_args():
    parser = argparse.ArgumentParser(
        formatter_class=argparse.ArgumentDefaultsHelpFormatter,
        description='Check Memory Savings')

    parser.add_argument('--data', required=False,
                        default='../../datas/yhoo-1996-2015.txt',
                        help='Data to be read in')

    parser.add_argument('--save', required=False, type=int, default=0,
                        help=('Memory saving level [1, 0, -1, -2]'))

    parser.add_argument('--datalines', required=False, action='store_true',
                        help=('Print data lines'))

    parser.add_argument('--lendetails', required=False, action='store_true',
                        help=('Print individual items memory usage'))

    parser.add_argument('--plot', required=False, action='store_true',
                        help=('Plot the result'))

    return parser.parse_args()

if __name__ == '__main__':
    runstrat()
在指标中混合时间框架
原文:
www.backtrader.com/blog/posts/2016-05-05-indicators-mixing-timeframes/indicators-mixing-timeframes/
发布版本 1.3.0.92 带来了一个新的可能性,可以将来自不同时间框架(数据源和/或指标)的数据混合在一起。
发布版本:github.com/mementum/backtrader/releases/tag/1.3.0.92
背景:指标是聪明的愚蠢对象。
-
它们很聪明,因为它们可以进行复杂的计算。
-
它们很笨,因为它们在不知道为计算提供数据的来源的情况下运行
如下所示:
- 如果提供值的数据源具有不同的时间框架,在
Cerebro引擎中长度不同,那么指标将会破裂。
一个计算的例子,在这个例子中data0的时间框架是天,而data1的时间框架是月:
pivotpoint = btind.PivotPoint(self.data1)
sellsignal = self.data0.close < pivotpoint.s1
这里寻找卖出信号,当收盘价低于s1线(第一个支撑位)时
注意
根据定义,PivotPoint在较大的时间框架中运行
这将在过去出现以下错误:
return self.array[self.idx + ago]
IndexError: array index out of range
出于一个很好的原因:self.data.close从第一个瞬间提供值,但PivotPoint(因此s1线)只有在整个月份过去后才会提供值,这大约相当于self.data0.close的 22 个值。在这 22 个closes中,还没有s1的值,并且从底层数组中获取它的尝试会失败。
线对象支持()操作符(Python中的__call__特殊方法)以提供其自身的延迟版本:
close1 = self.data.close(-1)
在此示例中,通过[0]访问close1对象始终包含close提供的先前值(-1)。语法已经被重用以适应不同的时间框架。让我们重写上述的pivotpoint片段:
pivotpoint = btind.PivotPoint(self.data1)
sellsignal = self.data0.close < pivotpoint.s1()
见如何在不带参数的情况下执行()(在后台提供一个None)。以下是发生的情况:
pivotpoint.s1()返回一个内部的LinesCoupler对象,该对象遵循更大范围的节奏。这个连接器会用来自实际s1的最新值填充自身(从NaN的默认值开始)
但是还需要一些额外的东西来使魔法生效。Cerebro必须使用以下内容创建:
cerebro = bt.Cerebro(runonce=False)
或者使用以下内容执行:
cerebro.run(runonce=False)
在此模式下,指标和延迟评估的自动线对象是逐步执行的,而不是在紧密循环中。这使整个操作变慢,但它使其可能
之前破解的底部示例脚本现在可以运行:
$ ./mixing-timeframes.py
输出为:
0021,0021,0001,2005-01-31,2984.75,2935.96,0.00
0022,0022,0001,2005-02-01,3008.85,2935.96,0.00
...
0073,0073,0003,2005-04-15,3013.89,3010.76,0.00
0074,0074,0003,2005-04-18,2947.79,3010.76,1.00
...
在交易 74 处,第 1 次发生close < s1。
该脚本还提供了另一个可能性的见解:将指标的所有线连接起来。之前我们有:
self.sellsignal = self.data0.close < pp.s1()
作为替代方案:
pp1 = pp()
self.sellsignal = self.data0.close < pp1.s1
现在整个PivotPoint指标已经耦合,并且可以访问其任何线条(即p、r1、r2、s1、s2)。脚本只对s1感兴趣,访问是直接的。:
$ ./mixing-timeframes.py --multi
输出:
0021,0021,0001,2005-01-31,2984.75,2935.96,0.00
0022,0022,0001,2005-02-01,3008.85,2935.96,0.00
...
0073,0073,0003,2005-04-15,3013.89,3010.76,0.00
0074,0074,0003,2005-04-18,2947.79,3010.76,1.00
...
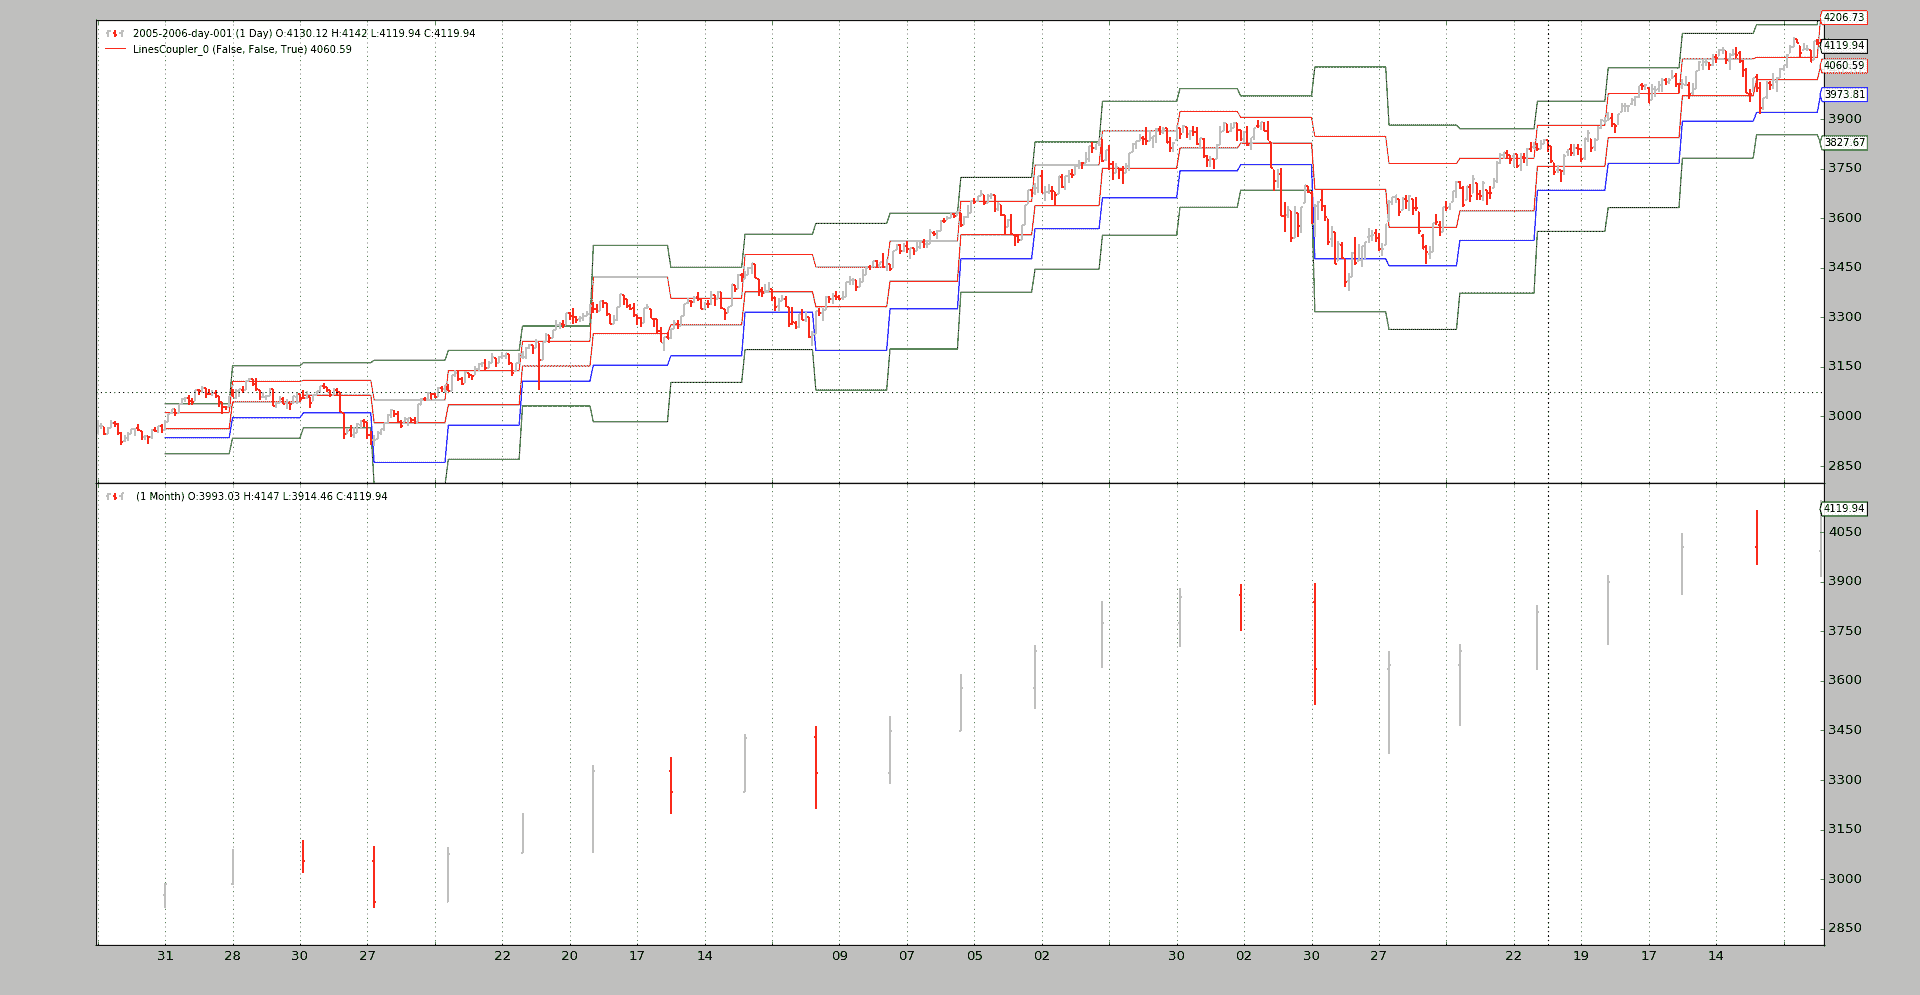
这里没有什么意外。与以前相同。甚至可以绘制“耦合”对象:
$ ./mixing-timeframes.py --multi --plot
完整的耦合语法
对于具有多个线条的lines对象(例如Indicators如PivotPoint):
-
obj(clockref=None, line=-1)- 如果
clockref为None,则周围的对象(在示例中为Strategy)将是调整较大时间框架(例如:Months)到较小/更快时间框架(例如:Days)的参考
如果愿意,可以使用另一个参考。
line- If the default `-1` is given, all *lines* are coupled. - If another integer (for example, `0` or `1`) a single line will be coupled and fetched by index (from `obj.lines[x]`) - If a string is passed, the line will be fetched by name. In the sample the following could have been done:coupled_s1 = pp(line='s1')
```py`
- 如果
对于lines对象只有一条线(例如指标PivotPoint的线条s1):
obj(clockref=None)(参见上面的clockref)
结论
在常规的()语法中,不同时间段的数据可以在指标中混合,始终考虑到需要使用runonce=False来实例化或创建cerebro。
脚本代码和用法
在backtrader的源代码中可用作示例。用法:
$ ./mixing-timeframes.py --help
usage: mixing-timeframes.py [-h] [--data DATA] [--multi] [--plot]

Sample for pivot point and cross plotting

optional arguments:
  -h, --help   show this help message and exit
  --data DATA  Data to be read in (default: ../../datas/2005-2006-day-001.txt)
  --multi      Couple all lines of the indicator (default: False)
  --plot       Plot the result (default: False)
代码:
from __future__ import (absolute_import, division, print_function,
                        unicode_literals)

import argparse

import backtrader as bt
import backtrader.feeds as btfeeds
import backtrader.indicators as btind
import backtrader.utils.flushfile

class St(bt.Strategy):
    params = dict(multi=True)

    def __init__(self):
        self.pp = pp = btind.PivotPoint(self.data1)
        pp.plotinfo.plot = False  # deactivate plotting

        if self.p.multi:
            pp1 = pp()  # couple the entire indicators
            self.sellsignal = self.data0.close < pp1.s1
        else:
            self.sellsignal = self.data0.close < pp.s1()

    def next(self):
        txt = ','.join(
            ['%04d' % len(self),
             '%04d' % len(self.data0),
             '%04d' % len(self.data1),
             self.data.datetime.date(0).isoformat(),
             '%.2f' % self.data0.close[0],
             '%.2f' % self.pp.s1[0],
             '%.2f' % self.sellsignal[0]])

        print(txt)

def runstrat():
    args = parse_args()

    cerebro = bt.Cerebro()
    data = btfeeds.BacktraderCSVData(dataname=args.data)
    cerebro.adddata(data)
    cerebro.resampledata(data, timeframe=bt.TimeFrame.Months)

    cerebro.addstrategy(St, multi=args.multi)

    cerebro.run(stdstats=False, runonce=False)
    if args.plot:
        cerebro.plot(style='bar')

def parse_args():
    parser = argparse.ArgumentParser(
        formatter_class=argparse.ArgumentDefaultsHelpFormatter,
        description='Sample for pivot point and cross plotting')

    parser.add_argument('--data', required=False,
                        default='../../datas/2005-2006-day-001.txt',
                        help='Data to be read in')

    parser.add_argument('--multi', required=False, action='store_true',
                        help='Couple all lines of the indicator')

    parser.add_argument('--plot', required=False, action='store_true',
                        help=('Plot the result'))

    return parser.parse_args()

if __name__ == '__main__':
    runstrat()
枢轴点和交叉绘图
原文:
www.backtrader.com/blog/posts/2016-04-28-pivot-point-cross-plotting/pivotpoint-crossplotting/
注意
这篇文章因历史原因而保留。 该指标和示例已在源中进行了更新,PivotPoint 现在可以自动连接自身,从而为用户代码删除了样板。
一个新的帖子将引用此帖子。 与此同时,请检查来源中的更新示例。
收到了一个有趣的请求:
- PivotPoint
它之所以有趣,是因为指标的定义方式。 文献可在 StockCharts 的 PivotPoint 中找到。 PivotPoints 使用过去时间段的 close、high 和 low 价格。 例如,对于每日时间段:
- 每日图表的枢轴点使用先前月份的数据
这可能看起来很麻烦,因为对于每个时间框架,都需要定义必须使用的其他时间框架。 查看公式会引起另一个问题:
Pivot Point (P) = (High + Low + Close)/3
Support 1 (S1) = (P x 2) - High
Support 2 (S2) = P  -  (High  -  Low)
Resistance 1 (R1) = (P x 2) - Low
Resistance 2 (R2) = P + (High  -  Low)
即使文本充满了对 先前期间 和 过去 … 的引用,但公式似乎是参考当前时刻。 让我们遵循 文本 的建议,在我们首次尝试 PivotPoint 时使用 previous。 但首先,让我们通过这样做来解决不同时间框架的问题:
- 该指标不会解决问题
尽管这可能看起来令人困惑,但必须考虑到 指标 必须尽可能愚蠢,并由实际公式组成。 问题将按以下方式解决:
data = btfeeds.ADataFeed(..., timeframe=bt.TimeFrame.Days)
cerebro.adddata(data)
cerebro.resampledata(data, timeframe=bt.TimeFrame.Months)
而后在 策略 中:
class MyStrategy(bt.Strategy):
    def __init__(self):
        self.pp = PivotPoint(self.data1)  # the resampled data
现在清楚了。 该系统将具有数据,再加上额外的输入重采样为所需的时间框架。 PivotPoint 指标将使用已重采样的数据工作,这些数据已处于所需的 每月 时间框架中,以供原始数据时间框架使用,即 每日。
指标可以被开发出来。 让我们从跟随文本指示开始,而不是公式,回望 1 期。
class PivotPoint1(bt.Indicator):
    lines = ('p', 's1', 's2', 'r1', 'r2',)

    def __init__(self):
        h = self.data.high(-1)  # previous high
        l = self.data.low(-1)  # previous low
        c = self.data.close(-1)  # previous close

        self.lines.p = p = (h + l + c) / 3.0

        p2 = p * 2.0
        self.lines.s1 = p2 - h  # (p x 2) - high
        self.lines.r1 = p2 - l  # (p x 2) - low

        hilo = h - l
        self.lines.s2 = p - hilo  # p - (high - low)
        self.lines.r2 = p + hilo  # p + (high - low)
该策略将查看参数 usepp1 来使用此 PivotPoint1
 def __init__(self):
        if self.p.usepp1:
            self.pp = PivotPoint1(self.data1)
        else:
            self.pp = PivotPoint(self.data1)
输出由一个简单的 next 方法控制
 def next(self):
        txt = ','.join(
            ['%04d' % len(self),
             '%04d' % len(self.data0),
             '%04d' % len(self.data1),
             self.data.datetime.date(0).isoformat(),
             '%.2f' % self.pp[0]])

        print(txt)
让我们执行:
./ppsample --usepp1
输出如下:
0041,0041,0002,2005-02-28,2962.79
0042,0042,0002,2005-03-01,2962.79
...
立即清楚的是:索引 41 已经属于第 2 个月。 这意味着我们已经跳过了 1 个月的指标计算。 现在清楚了为什么 StockCharts 中的文本总是提到计算是在前一个 月 进行的,但公式似乎是参考当前时刻。
-
开发人员可能面临相同的设计决策,即多个数据具有多个时间框架。
在当前 每日 点上,只能交付上一个 月 的 关闭 柱。
这就是为什么 next 方法看的是索引 [0]。 所有这些都有一个非常简单的解决方法,那就是按照 StockCharts 记录的方式编写公式。
class PivotPoint(bt.Indicator):
    lines = ('p', 's1', 's2', 'r1', 'r2',)
    plotinfo = dict(subplot=False)

    def __init__(self):
        h = self.data.high  # current high
        l = self.data.low  # current high
        c = self.data.close  # current high

        self.lines.p = p = (h + l + c) / 3.0

        p2 = p * 2.0
        self.lines.s1 = p2 - h  # (p x 2) - high
        self.lines.r1 = p2 - l  # (p x 2) - low

        hilo = h - l
        self.lines.s2 = p - hilo  # p - (high - low)
        self.lines.r2 = p + hilo  # p + (high - low)
没有 usepp1 的执行:
./ppsample
新输出如下:
0021,0021,0001,2005-01-31,2962.79
0022,0022,0001,2005-02-01,2962.79
...
啊哈!第 1 个月有20个交易日,一旦完成,指标就计算出值并可以传送。唯一打印的行是p,如果两行中的值相同,则是因为该值在整个下一个月内保持不变。引用StockCharts:
Once Pivot Points are set, they do not change and remain in play throughout ...
指标已经可以使用。让我们开始绘图吧。绘图参数已经设置好。
plotinfo = dict(subplot=False)
计算出的值与数据比例一致,并且就像移动平均线一样,可以沿着数据绘制(因此subplot=False)
使用--plot进行执行:
./ppsample --plot
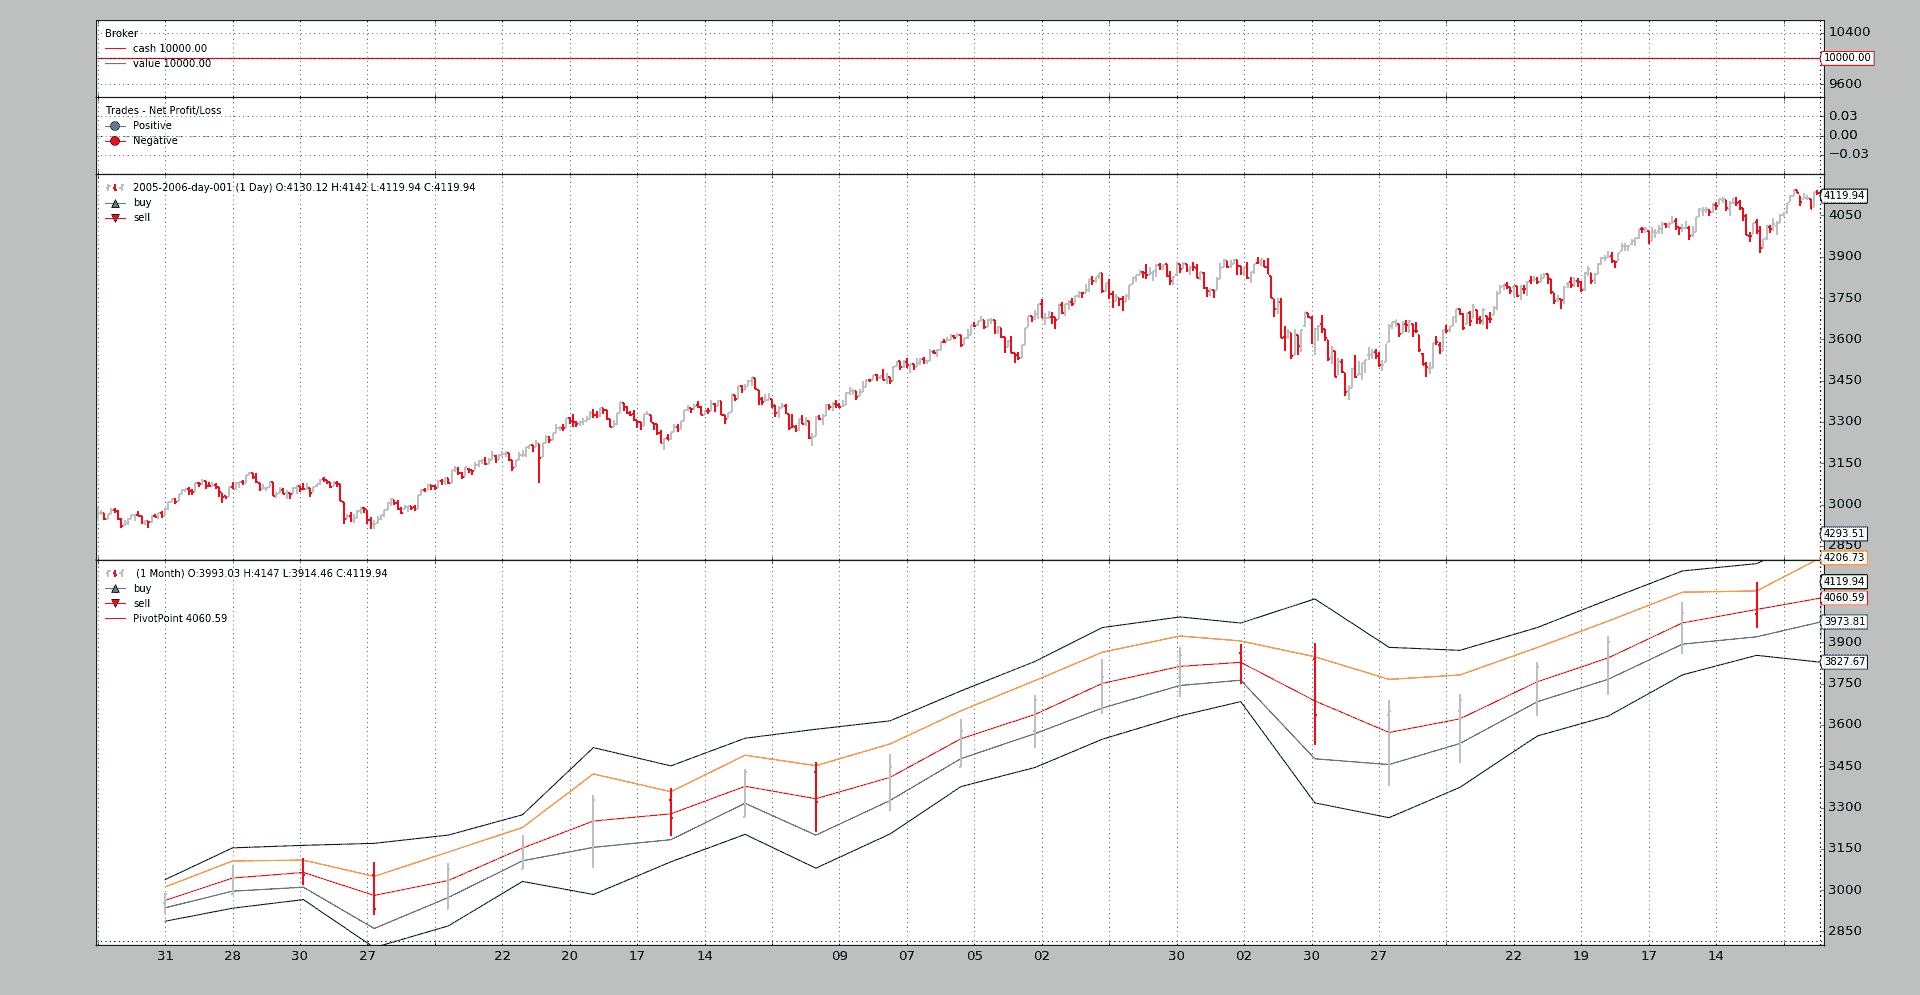
惊人的海蜗牛又开始袭击了。该指标已经绘制在月度数据(其源)上,这在日线图上没有任何视觉指示,而在日线图上,它将非常有帮助。
但backtrader支持从一个数据到另一个数据的交叉绘图。虽然需要在1.2.8.88中进行小的添加以支持将数据交叉绘制到不同时间框架的数据上。
这是通过让plotmaster指定绘图目标来实现的,将其添加到指标的plotinfo属性中:
./ppsample --plot --plot-on-daily
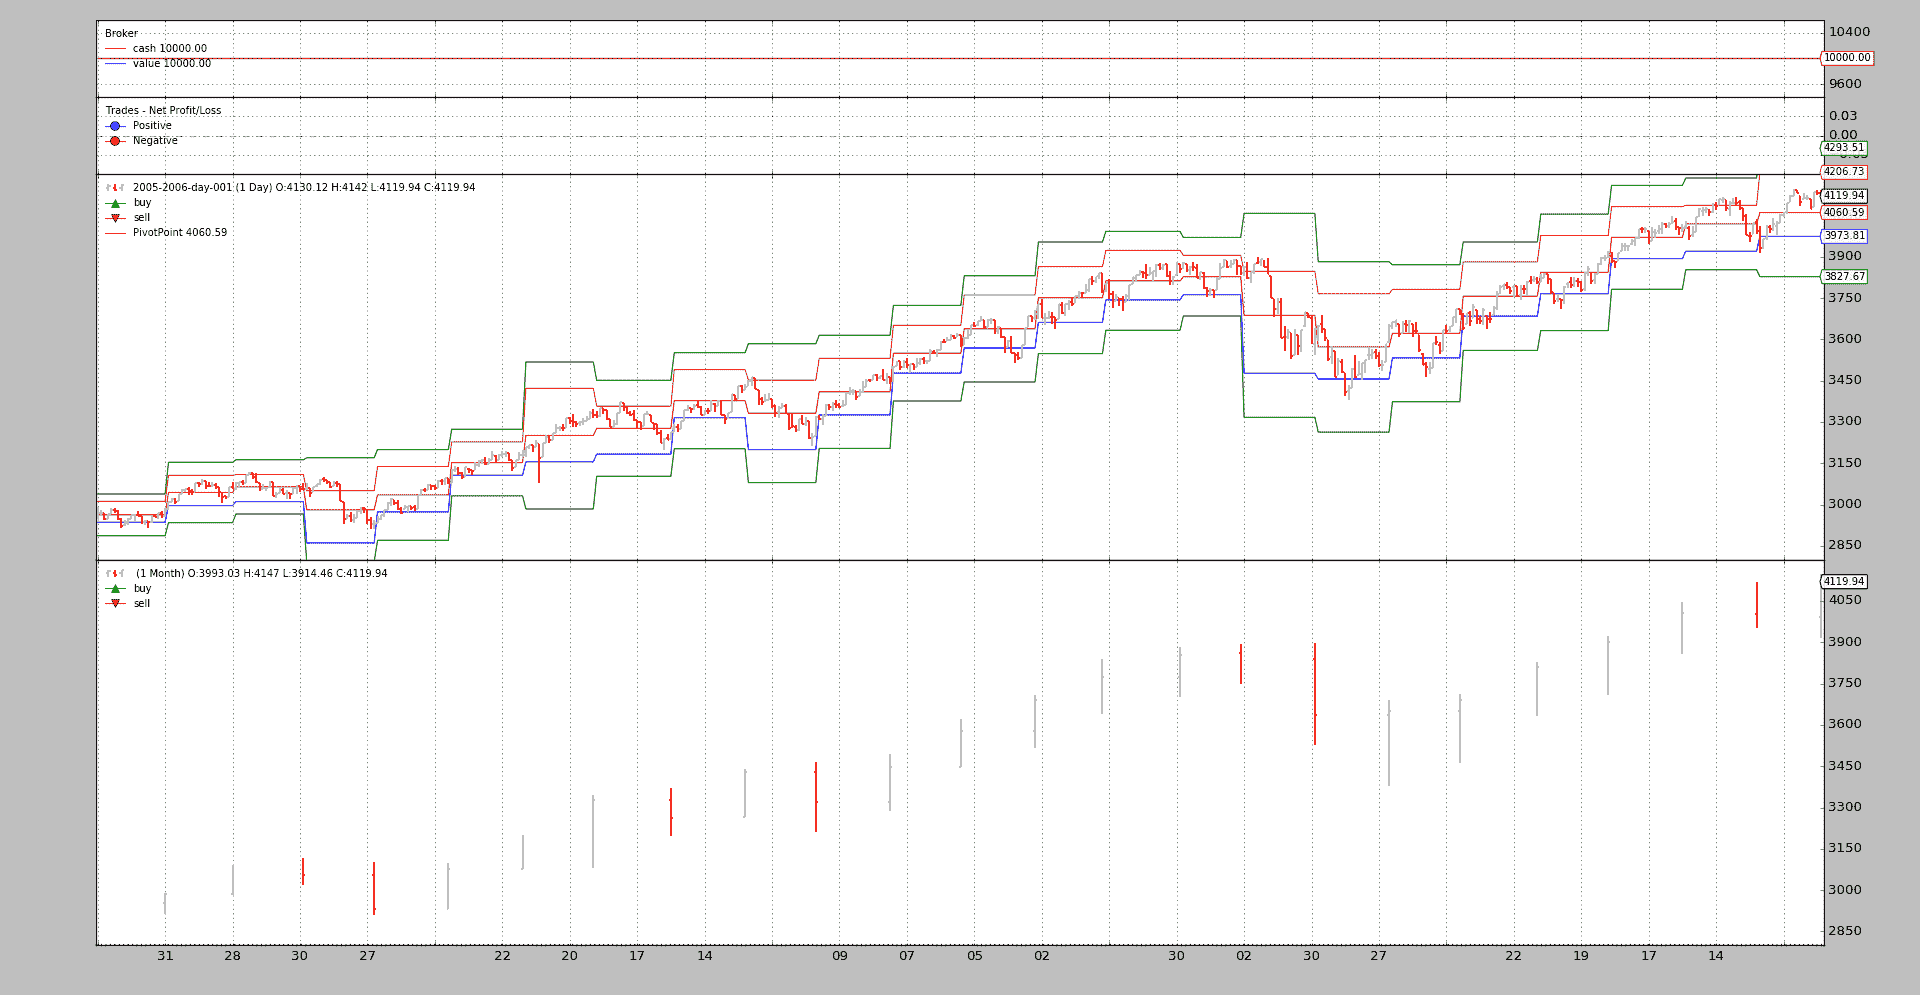
现在视觉反馈对于理解PivotPoint正在提供的内容非常有用。
脚本代码和用法
在backtrader源码中提供为样例:
$ ./ppsample.py --help
usage: ppsample.py [-h] [--data DATA] [--usepp1] [--plot] [--plot-on-daily]

Sample for pivot point and cross plotting

optional arguments:
  -h, --help       show this help message and exit
  --data DATA      Data to be read in (default:
                   ../../datas/2005-2006-day-001.txt)
  --usepp1         Have PivotPoint look 1 period backwards (default: False)
  --plot           Plot the result (default: False)
  --plot-on-daily  Plot the indicator on the daily data (default: False)
PivotPoint的代码
from __future__ import (absolute_import, division, print_function,)
#                        unicode_literals)

import backtrader as bt

class PivotPoint1(bt.Indicator):
    lines = ('p', 's1', 's2', 'r1', 'r2',)

    def __init__(self):
        h = self.data.high(-1)  # previous high
        l = self.data.low(-1)  # previous low
        c = self.data.close(-1)  # previous close

        self.lines.p = p = (h + l + c) / 3.0

        p2 = p * 2.0
        self.lines.s1 = p2 - h  # (p x 2) - high
        self.lines.r1 = p2 - l  # (p x 2) - low

        hilo = h - l
        self.lines.s2 = p - hilo  # p - (high - low)
        self.lines.r2 = p + hilo  # p + (high - low)

class PivotPoint(bt.Indicator):
    lines = ('p', 's1', 's2', 'r1', 'r2',)
    plotinfo = dict(subplot=False)

    def __init__(self):
        h = self.data.high  # current high
        l = self.data.low  # current high
        c = self.data.close  # current high

        self.lines.p = p = (h + l + c) / 3.0

        p2 = p * 2.0
        self.lines.s1 = p2 - h  # (p x 2) - high
        self.lines.r1 = p2 - l  # (p x 2) - low

        hilo = h - l
        self.lines.s2 = p - hilo  # p - (high - low)
        self.lines.r2 = p + hilo  # p + (high - low)
脚本的代码。
from __future__ import (absolute_import, division, print_function,
                        unicode_literals)

import argparse

import backtrader as bt
import backtrader.feeds as btfeeds
import backtrader.utils.flushfile

from pivotpoint import PivotPoint, PivotPoint1

class St(bt.Strategy):
    params = (('usepp1', False),
              ('plot_on_daily', False))

    def __init__(self):
        if self.p.usepp1:
            self.pp = PivotPoint1(self.data1)
        else:
            self.pp = PivotPoint(self.data1)

        if self.p.plot_on_daily:
            self.pp.plotinfo.plotmaster = self.data0

    def next(self):
        txt = ','.join(
            ['%04d' % len(self),
             '%04d' % len(self.data0),
             '%04d' % len(self.data1),
             self.data.datetime.date(0).isoformat(),
             '%.2f' % self.pp[0]])

        print(txt)

def runstrat():
    args = parse_args()

    cerebro = bt.Cerebro()
    data = btfeeds.BacktraderCSVData(dataname=args.data)
    cerebro.adddata(data)
    cerebro.resampledata(data, timeframe=bt.TimeFrame.Months)

    cerebro.addstrategy(St,
                        usepp1=args.usepp1,
                        plot_on_daily=args.plot_on_daily)
    cerebro.run()
    if args.plot:
        cerebro.plot(style='bar')

def parse_args():
    parser = argparse.ArgumentParser(
        formatter_class=argparse.ArgumentDefaultsHelpFormatter,
        description='Sample for pivot point and cross plotting')

    parser.add_argument('--data', required=False,
                        default='../../datas/2005-2006-day-001.txt',
                        help='Data to be read in')

    parser.add_argument('--usepp1', required=False, action='store_true',
                        help='Have PivotPoint look 1 period backwards')

    parser.add_argument('--plot', required=False, action='store_true',
                        help=('Plot the result'))

    parser.add_argument('--plot-on-daily', required=False, action='store_true',
                        help=('Plot the indicator on the daily data'))

    return parser.parse_args()

if __name__ == '__main__':
    runstrat()
同步不同的市场
原文:
www.backtrader.com/blog/posts/2016-04-19-sync-different-markets/sync-different-markets/
使用越多,backtrader 面对的想法和意外情况就越多。随着每一个新的想法,都是一个挑战,看看平台是否能够实现开发时设定的期望,灵活性和易用性是目标,Python 被选择为基石。
Ticket #76 提出了一个问题,即是否可以同步具有不同交易日历的市场。直接尝试这样做会失败,问题的创建者想知道为什么 backtrader 没有查看日期。
在做出任何答复之前,必须考虑一些想法:
- 对于不对齐的日子指标的行为
后者的答案是:
- 该平台尽可能是
日期和时间不可知的,并且不会查看字段的内容来评估这些概念
考虑到股票市场价格是 datetime 系列,上述情况在一定程度上是成立的。在多个数据的情况下,以下设计考虑因素适用:
-
添加到
cerebro的第一条数据是datamaster -
所有其他数据都必须与其进行时间对齐/同步,永远不能超过(在
datetime方面)datamaster
将上述的三个要点组合在一起,得到了问题创建者所经历的混合体。情景如下:
-
日历年份:
2012 -
数据 0:
^GSPC(或者朋友们称之为标普 500 指数) -
数据 1:
^GDAXI(或者朋友们称之为德国 DAX 指数)
运行一个自定义脚本,查看backtrader如何同步数据:
$ ./weekdaysaligner.py --online --data1 '^GSPC' --data0 '^GDAXI'
输出如下:
0001,  True, data0, 2012-01-03T23:59:59, 2012-01-03T23:59:59, data1
0002,  True, data0, 2012-01-04T23:59:59, 2012-01-04T23:59:59, data1
0003,  True, data0, 2012-01-05T23:59:59, 2012-01-05T23:59:59, data1
0004,  True, data0, 2012-01-06T23:59:59, 2012-01-06T23:59:59, data1
0005,  True, data0, 2012-01-09T23:59:59, 2012-01-09T23:59:59, data1
0006,  True, data0, 2012-01-10T23:59:59, 2012-01-10T23:59:59, data1
0007,  True, data0, 2012-01-11T23:59:59, 2012-01-11T23:59:59, data1
0008,  True, data0, 2012-01-12T23:59:59, 2012-01-12T23:59:59, data1
0009,  True, data0, 2012-01-13T23:59:59, 2012-01-13T23:59:59, data1
0010, False, data0, 2012-01-17T23:59:59, 2012-01-16T23:59:59, data1
0011, False, data0, 2012-01-18T23:59:59, 2012-01-17T23:59:59, data1
...
一旦到达 2012-01-16,交易日历就开始分歧。data0 是 datamaster(^GSPC),即使 data1(^GDAXI)在 2012-01-16 有一根柱子要交付,这对于S&P 500 来说并不是一个交易日。
当 ^GSPC 的下一个交易日到来时,backtrader在上述设计限制下能做的最好的事情是,提供 ^GDAXI` 的下一个尚未处理的日期,即 `2012-01-16`。
随着每一天的分歧,同步问题逐渐累积。在 2012 年末,情况如下:
...
0249, False, data0, 2012-12-28T23:59:59, 2012-12-19T23:59:59, data1
0250, False, data0, 2012-12-31T23:59:59, 2012-12-20T23:59:59, data1
原因应该是显而易见的:欧洲人交易的日子比美国人多。
在 Ticket #76 github.com/mementum/backtrader/issues/76 中,作者展示了 zipline 的操作。让我们来看看 2012-01-13 - 2012-01-17 的难题:
0009 : True : 2012-01-13 : close 1289.09 - 2012-01-13 :  close 6143.08
0010 : False : 2012-01-13 : close 1289.09 - 2012-01-16 :  close 6220.01
0011 : True : 2012-01-17 : close 1293.67 - 2012-01-17 :  close 6332.93
需要注意!2012-01-13 的数据已经被简单地复制,似乎没有征求用户的许可。在我看来,这不应该发生,因为平台的最终用户无法撤销这种自发添加。
注意
除了简要查看zipline,作者不知道这是否是标准行为,由脚本开发者配置,以及是否可以撤消。
一旦我们已经看到其他内容,让我们再次尝试使用累积的智慧,使用backtrader:欧洲人比美国人交易频繁。让我们颠倒^GSPC和^GDAXI的角色,看看结果:
$ ./weekdaysaligner.py --online --data1 '^GSPC' --data0 '^GDAXI'
输出(直接跳转到2012-01-13):
...
0009,  True, data0, 2012-01-13T23:59:59, 2012-01-13T23:59:59, data1
0010, False, data0, 2012-01-16T23:59:59, 2012-01-13T23:59:59, data1
0011,  True, data0, 2012-01-17T23:59:59, 2012-01-17T23:59:59, data1
...
该死的!backtrader也复制了2012-01-13值作为data0(现在为^GDAXI)的交付,以匹配data1(在此情况下为^GSPC)的交付,这是2012-01-16。
更好的是:
- 同步已经在下一个日期
2012-01-17中达到
不久之后再次看到相同的重新同步:
...
0034,  True, data0, 2012-02-17T23:59:59, 2012-02-17T23:59:59, data1
0035, False, data0, 2012-02-20T23:59:59, 2012-02-17T23:59:59, data1
0036,  True, data0, 2012-02-21T23:59:59, 2012-02-21T23:59:59, data1
...
紧接着是不那么容易的重新同步:
...
0068,  True, data0, 2012-04-05T23:59:59, 2012-04-05T23:59:59, data1
0069, False, data0, 2012-04-10T23:59:59, 2012-04-09T23:59:59, data1
...
0129, False, data0, 2012-07-04T23:59:59, 2012-07-03T23:59:59, data1
0130,  True, data0, 2012-07-05T23:59:59, 2012-07-05T23:59:59, data1
...
这种情节会一直重复,直到最后一个^GDAXI柱形图被提供:
...
0256,  True, data0, 2012-12-31T23:59:59, 2012-12-31T23:59:59, data1
...
这种同步问题的原因是backtrader不会复制数据。
-
一旦
datamaster提供了一个新的柱形图,其他数据就会被要求提供 -
如果对于
datamaster当前的datetime来说没有柱形图可提供(例如,因为它被超越了),那么就会提供下一个最佳数据,可以说是重新提供这是一个已经见过的
日期的柱形图
正确的同步
但并非一切希望都已消失。backtrader 可以实现。让我们使用过滤器。backtrader 中的这项技术允许在数据到达平台最深层之前对其进行操作,例如计算指标。
注意
“交付”是一个感知问题,因此backtrader提供的可能不是接收者所期望的交付
实际代码如下
from __future__ import (absolute_import, division, print_function,
                        unicode_literals)

import datetime

class WeekDaysFiller(object):
    '''Bar Filler to add missing calendar days to trading days'''
    # kickstart value for date comparisons
    lastdt = datetime.datetime.max.toordinal()

    def __init__(self, data, fillclose=False):
        self.fillclose = fillclose
        self.voidbar = [float('Nan')] * data.size()  # init a void bar

    def __call__(self, data):
        '''Empty bars (NaN) or with last close price are added for weekdays with no
        data

        Params:
          - data: the data source to filter/process

        Returns:
          - True (always): bars are removed (even if put back on the stack)

        '''
        dt = data.datetime.dt()  # current date in int format
        lastdt = self.lastdt + 1  # move the last seen data once forward

        while lastdt < dt:  # loop over gap bars
            if datetime.date.fromordinal(lastdt).isoweekday() < 6:  # Mon-Fri
                # Fill in date and add new bar to the stack
                if self.fillclose:
                    self.voidbar = [self.lastclose] * data.size()
                self.voidbar[-1] = float(lastdt) + data.sessionend
                data._add2stack(self.voidbar[:])

            lastdt += 1  # move lastdt forward

        self.lastdt = dt  # keep a record of the last seen date

        self.lastclose = data.close[0]
        data._save2stack(erase=True)  # dt bar to the stack and out of stream
        return True  # bars are on the stack (new and original)
测试脚本已经具备使用它的能力:
$ ./weekdaysaligner.py --online --data0 '^GSPC' --data1 '^GDAXI' --filler
使用--filler,WeekDaysFiller被添加到data0和data1。并且输出:
0001,  True, data0, 2012-01-03T23:59:59, 2012-01-03T23:59:59, data1
...
0009,  True, data0, 2012-01-13T23:59:59, 2012-01-13T23:59:59, data1
0010,  True, data0, 2012-01-16T23:59:59, 2012-01-16T23:59:59, data1
0011,  True, data0, 2012-01-17T23:59:59, 2012-01-17T23:59:59, data1
...
在2012-01-13至2012-01-17期间的第 1 个难题已经解决。并且整个集合已经同步:
...
0256,  True, data0, 2012-12-25T23:59:59, 2012-12-25T23:59:59, data1
0257,  True, data0, 2012-12-26T23:59:59, 2012-12-26T23:59:59, data1
0258,  True, data0, 2012-12-27T23:59:59, 2012-12-27T23:59:59, data1
0259,  True, data0, 2012-12-28T23:59:59, 2012-12-28T23:59:59, data1
0260,  True, data0, 2012-12-31T23:59:59, 2012-12-31T23:59:59, data1
值得注意的是:
-
使用
^GSPC作为data0,我们有250行(该指数在2012年交易了250天) -
使用
^GDAXI,我们data0有256行(该指数在2012年交易了256天) -
并且通过放置
WeekDaysFiller,两个数据集的长度已经扩展到260。添加
52*2(周末和周末的天数),我们会得到364。一年中剩余的一天肯定是一个星期六或一个星期天。
过滤器正在用NaN值进行填充,用于给定数据中没有交易发生的日子。让我们来绘制它:
$ ./weekdaysaligner.py --online --data0 '^GSPC' --data1 '^GDAXI' --filler --plot
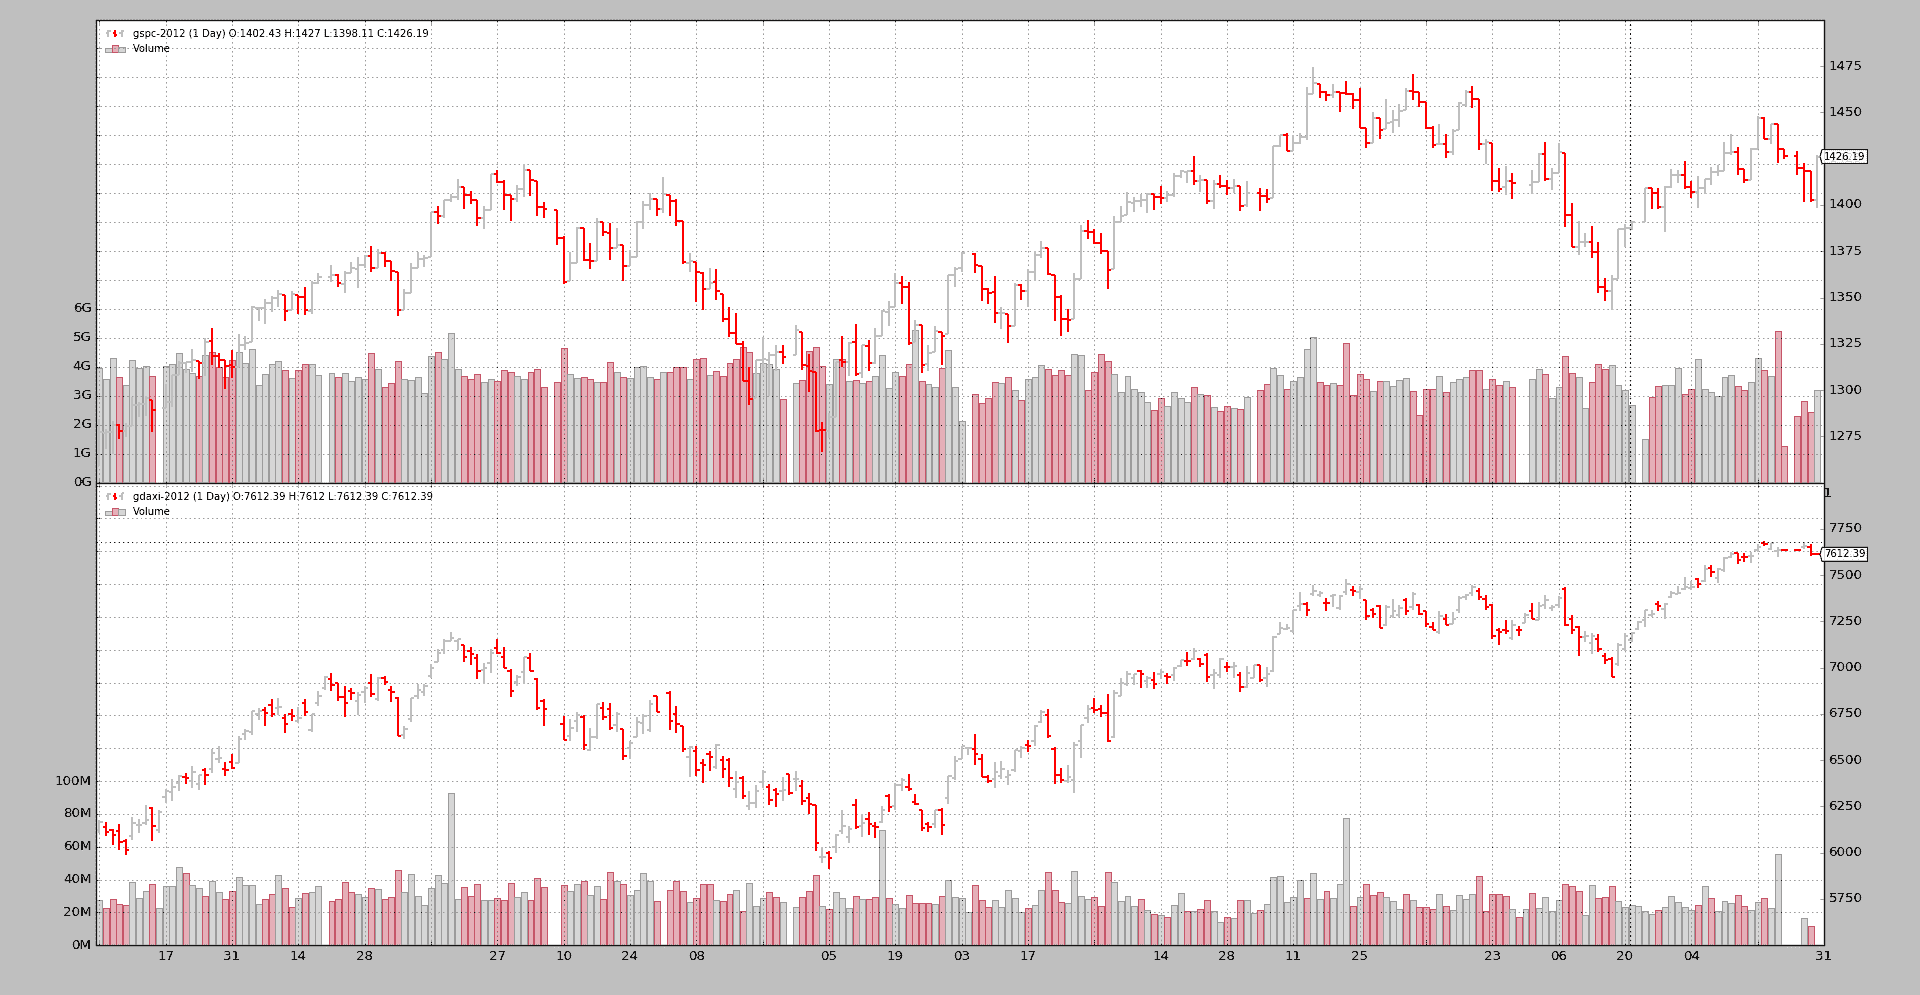
填充的日子相当明显:
-
条之间的间隙还在
-
对于成交量图来说,这个间隙更加明显
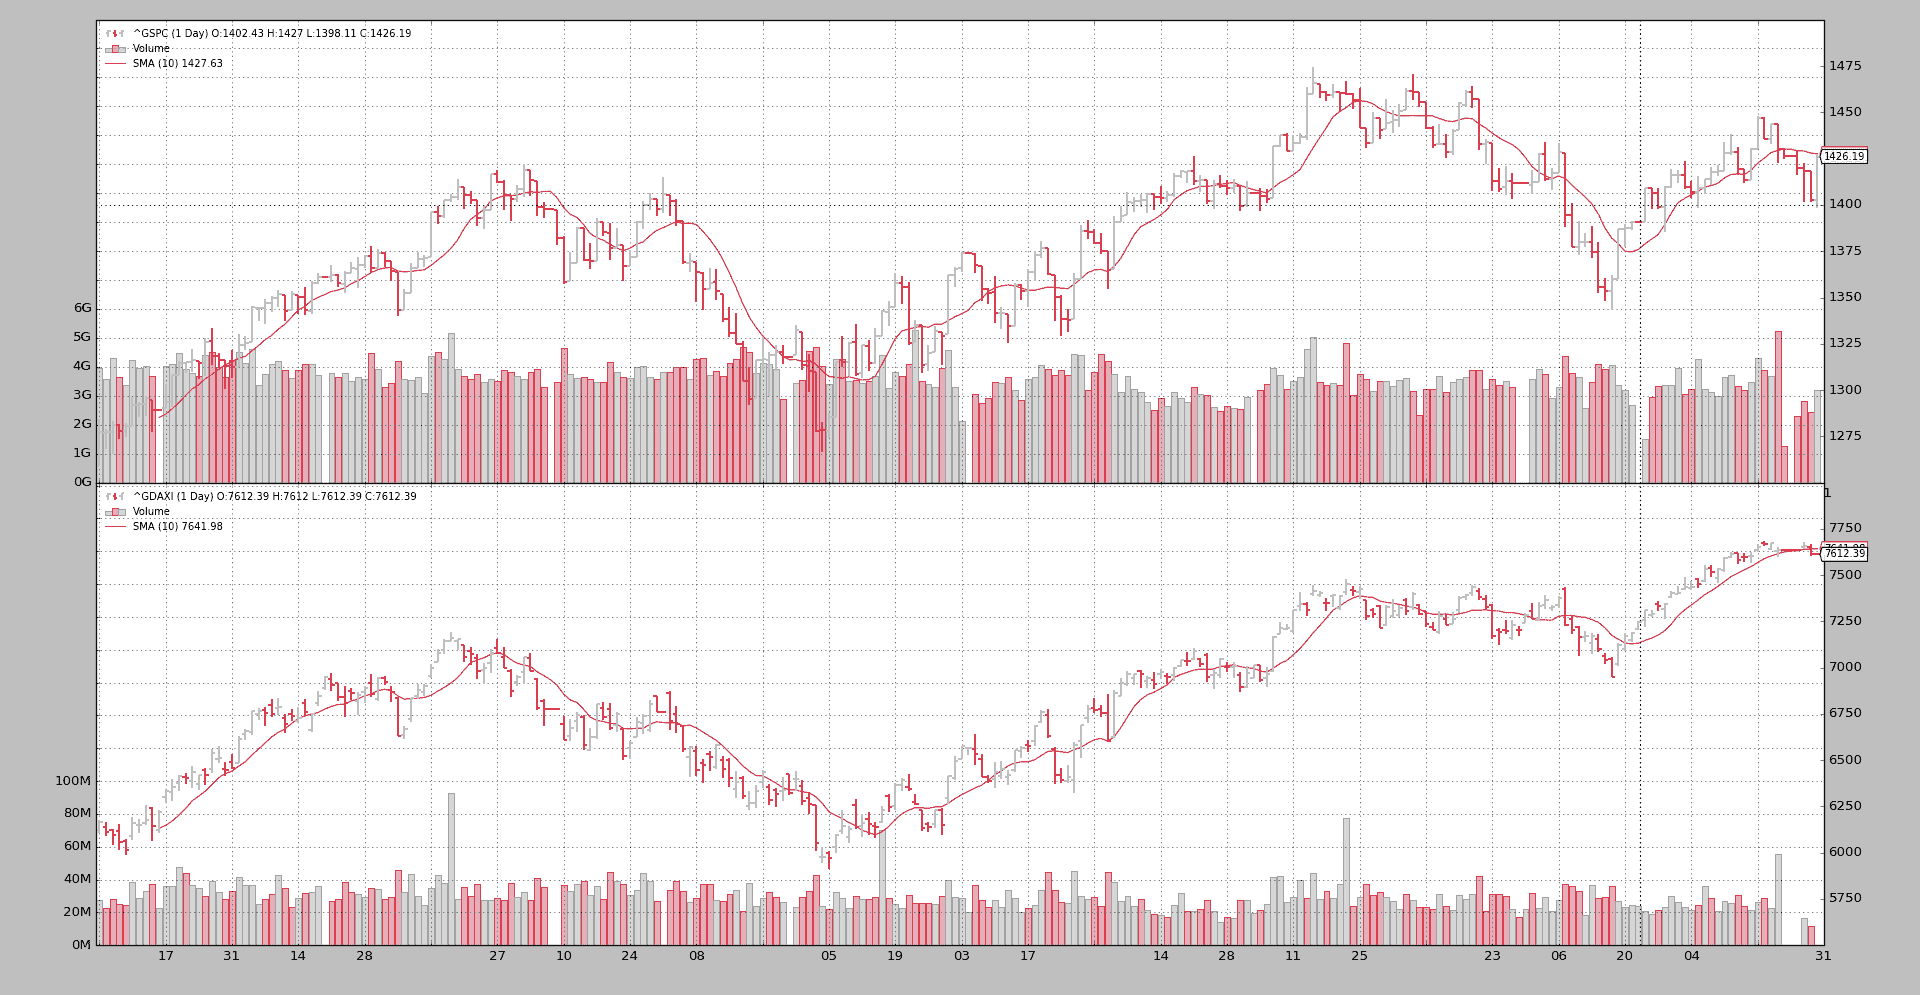
第 2 个绘图将尝试回答顶部的问题:指标会发生什么情况?请记住,新的柱形图已经被赋予了NaN的值(这就是它们没有显示的原因):
$ ./weekdaysaligner.py --online --data0 '^GSPC' --data1 '^GDAXI' --filler --plot --sma 10
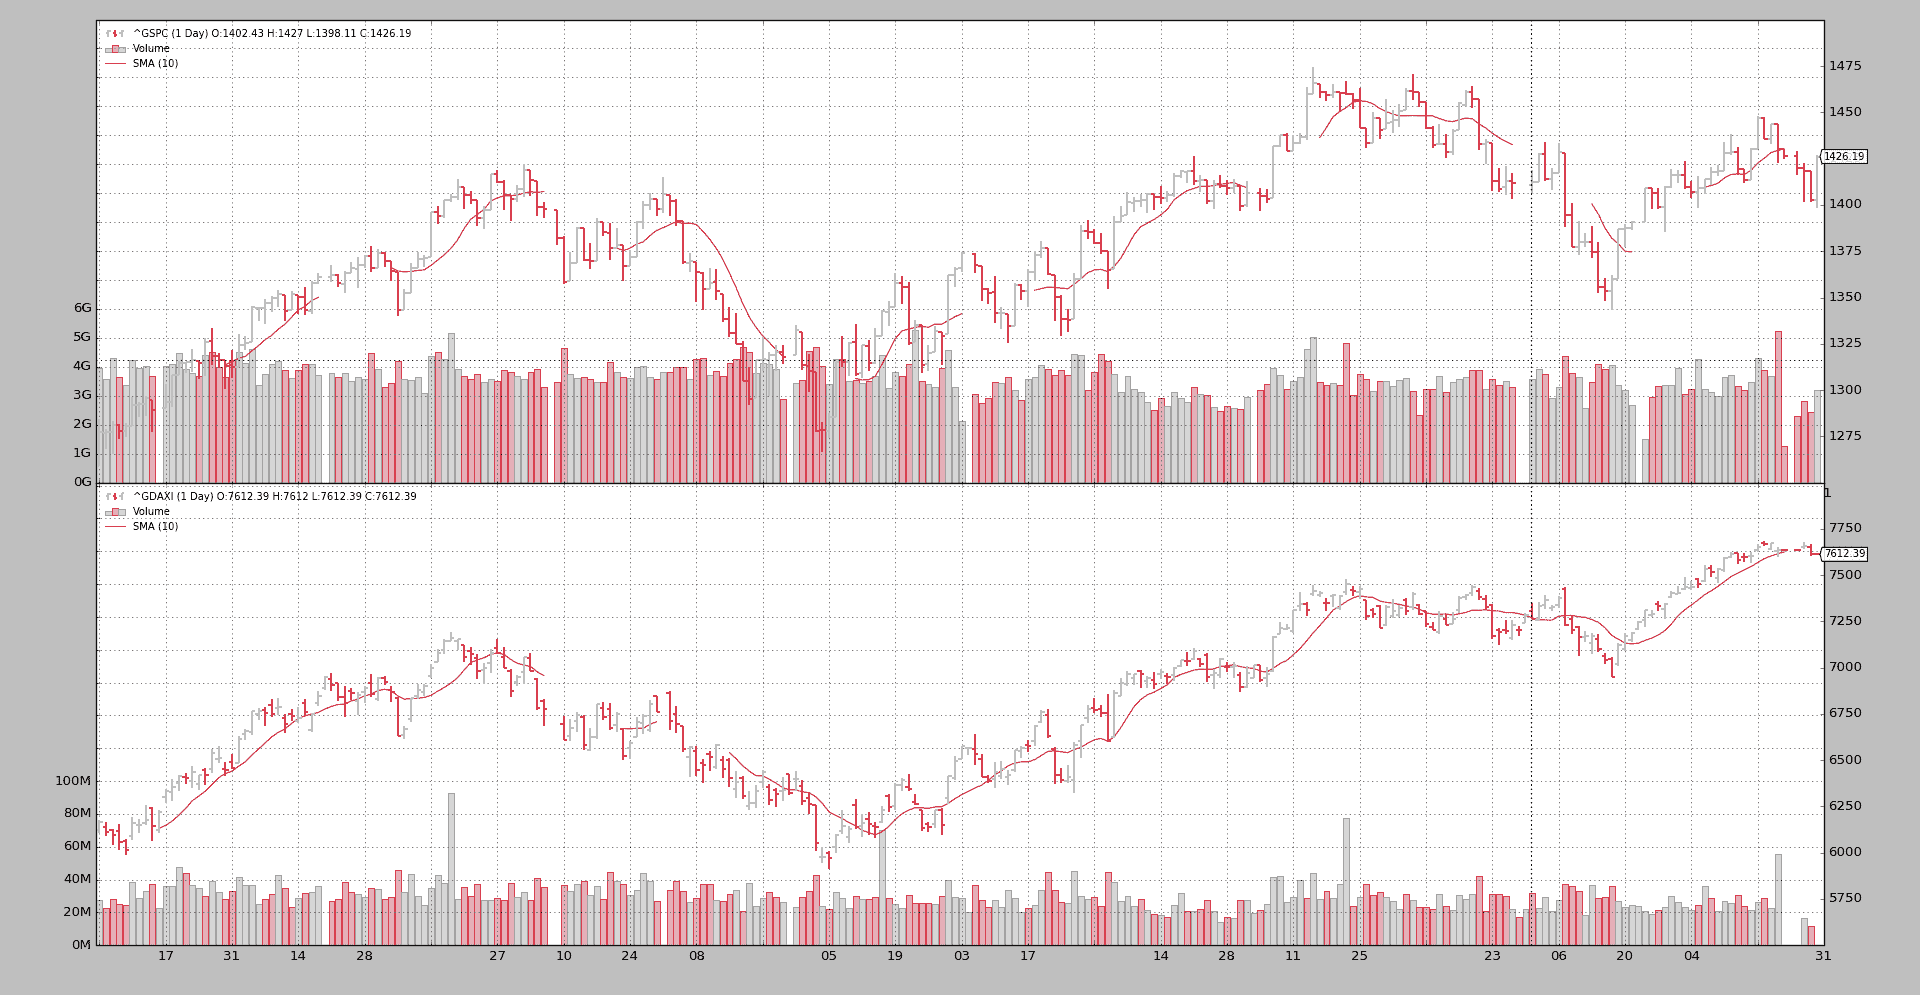
重新贴上船壳!简单移动平均 打破了时空连续体,并跳过一些柱,没有连续解。这当然是 Not a Number(NaN)填充的效果:数学运算不再有意义。
如果使用的不是 NaN 而是上次观察到的收盘价:
$ ./weekdaysaligner.py --online --data0 '^GSPC' --data1 '^GDAXI' --filler --plot --sma 10 --fillclose
整个 260 天使用正常 SMA 绘制的图表看起来更加漂亮。
结论
同步两个具有不同交易日历的工具是一个做出决策和妥协的问题。backtrader 需要时间对齐的数据来处理多个数据和不同的交易日历并不会有所帮助。
此处描述的 WeekDaysFiller 的使用可以缓解这种情况,但这绝不是一种普遍的灵丹妙药,因为用什么值来填充是一个长期而且长时间的考虑问题。
脚本代码和用法
在 backtrader 源码中可用作示例:
$ ./weekdaysaligner.py --help
usage: weekdaysaligner.py [-h] [--online] --data0 DATA0 [--data1 DATA1]
                          [--sma SMA] [--fillclose] [--filler] [--filler0]
                          [--filler1] [--fromdate FROMDATE] [--todate TODATE]
                          [--plot]

Sample for aligning with trade

optional arguments:
  -h, --help            show this help message and exit
  --online              Fetch data online from Yahoo (default: False)
  --data0 DATA0         Data 0 to be read in (default: None)
  --data1 DATA1         Data 1 to be read in (default: None)
  --sma SMA             Add a sma to the datas (default: 0)
  --fillclose           Fill with Close price instead of NaN (default: False)
  --filler              Add Filler to Datas 0 and 1 (default: False)
  --filler0             Add Filler to Data 0 (default: False)
  --filler1             Add Filler to Data 1 (default: False)
  --fromdate FROMDATE, -f FROMDATE
                        Starting date in YYYY-MM-DD format (default:
                        2012-01-01)
  --todate TODATE, -t TODATE
                        Ending date in YYYY-MM-DD format (default: 2012-12-31)
  --plot                Do plot (default: False)
代码:
from __future__ import (absolute_import, division, print_function,
                        unicode_literals)

import argparse
import datetime

import backtrader as bt
import backtrader.feeds as btfeeds
import backtrader.indicators as btind
import backtrader.utils.flushfile

# from wkdaysfiller import WeekDaysFiller
from weekdaysfiller import WeekDaysFiller

class St(bt.Strategy):
    params = (('sma', 0),)

    def __init__(self):
        if self.p.sma:
            btind.SMA(self.data0, period=self.p.sma)
            btind.SMA(self.data1, period=self.p.sma)

    def next(self):
        dtequal = (self.data0.datetime.datetime() ==
                   self.data1.datetime.datetime())

        txt = ''
        txt += '%04d, %5s' % (len(self), str(dtequal))
        txt += ', data0, %s' % self.data0.datetime.datetime().isoformat()
        txt += ', %s, data1' % self.data1.datetime.datetime().isoformat()
        print(txt)

def runstrat():
    args = parse_args()

    fromdate = datetime.datetime.strptime(args.fromdate, '%Y-%m-%d')
    todate = datetime.datetime.strptime(args.todate, '%Y-%m-%d')

    cerebro = bt.Cerebro(stdstats=False)

    DataFeed = btfeeds.YahooFinanceCSVData
    if args.online:
        DataFeed = btfeeds.YahooFinanceData

    data0 = DataFeed(dataname=args.data0, fromdate=fromdate, todate=todate)

    if args.data1:
        data1 = DataFeed(dataname=args.data1, fromdate=fromdate, todate=todate)
    else:
        data1 = data0.clone()

    if args.filler or args.filler0:
        data0.addfilter(WeekDaysFiller, fillclose=args.fillclose)

    if args.filler or args.filler1:
        data1.addfilter(WeekDaysFiller, fillclose=args.fillclose)

    cerebro.adddata(data0)
    cerebro.adddata(data1)

    cerebro.addstrategy(St, sma=args.sma)
    cerebro.run(runonce=True, preload=True)

    if args.plot:
        cerebro.plot(style='bar')

def parse_args():
    parser = argparse.ArgumentParser(
        formatter_class=argparse.ArgumentDefaultsHelpFormatter,
        description='Sample for aligning with trade ')

    parser.add_argument('--online', required=False, action='store_true',
                        help='Fetch data online from Yahoo')

    parser.add_argument('--data0', required=True, help='Data 0 to be read in')
    parser.add_argument('--data1', required=False, help='Data 1 to be read in')

    parser.add_argument('--sma', required=False, default=0, type=int,
                        help='Add a sma to the datas')

    parser.add_argument('--fillclose', required=False, action='store_true',
                        help='Fill with Close price instead of NaN')

    parser.add_argument('--filler', required=False, action='store_true',
                        help='Add Filler to Datas 0 and 1')

    parser.add_argument('--filler0', required=False, action='store_true',
                        help='Add Filler to Data 0')

    parser.add_argument('--filler1', required=False, action='store_true',
                        help='Add Filler to Data 1')

    parser.add_argument('--fromdate', '-f', default='2012-01-01',
                        help='Starting date in YYYY-MM-DD format')

    parser.add_argument('--todate', '-t', default='2012-12-31',
                        help='Ending date in YYYY-MM-DD format')

    parser.add_argument('--plot', required=False, action='store_true',
                        help='Do plot')

    return parser.parse_args()

if __name__ == '__main__':
    runstrat()