import numpy as np
import matplotlib.pyplot as plt
第一题
第1问 HF状态预测
先回顾一下要用到的离散贝叶斯滤波算法。
\[\begin{aligned} 1:\quad&\textbf{Algorithm Discrete\_Bayes\_filter(}\{p_{k,t-1}\},u_t,z_t\textbf{):}\\ 2:\quad&\quad \text{for all}\ k\ \text{do}\\ 3:\quad&\quad\quad\bar p_{k,t}=\sum\limits_ip(x_{k,t}|u_t,x_{i,t-1})p_{i,t-1}\\ 4:\quad&\quad\quad p_{k,t}=\eta p(z_t|X_t=x_k)\bar p_{k,t}\\ 5:\quad&\quad \text{endfor}\\ 6:\quad&\quad\text{return}\ \{p_{k,t}\} \end{aligned} \]第1问关注第2~3行,首先讨论一下这一小块算法的等价形式以方便代码实现。这一小块算法遍历了状态预测后的直方图的各小格,每一次遍历都在考虑先验的直方图中的每一格,对估计后的直方图的遍历到的那一小格的影响。这个过程可以等价于,遍历先验估计中的直方图,每一次遍历都考虑遍历到的那一小格对状态预测后的直方图的每一小格的影响。我感觉后者更方便代码实现一些。
实现直方图的一个关键在于分解状态空间。这里的状态空间是无限大的,至于有没有什么方法是最优的我就不知道啦,现在就先按每一方格STEPS宽、以原点为中心有一格、分成BINSxBINS格尝试一下。
BINS = 101  # 直方图一个维度上的格子数
STEP = 0.2  # 每一格对应的范围
RANGE = STEP / 2 + BINS // 2 * STEP # 一个方向(比如x轴正方向)上的范围,已默认中点在原点
CENTER = BINS // 2  # 中点处的索引
状态转移模型为:
\[p(x_t\mid u_t,x_{t-1})=[\det(2\pi R)]^{-\frac{1}{2}}\exp\left[ -\frac{1}{2}(x_t-Ax_{t-1})^TR^{-1}(x_t-Ax_{t-1}) \right] \]其中\(A=\begin{bmatrix}1&1\\0&1\end{bmatrix}\), \(R=\begin{bmatrix}1/4&1/2\\1/2&1\end{bmatrix}\)。这是一个均值向量随状态改变、但协方差矩阵不变的二维高斯分布。为了提高效率、也为了使计算出的\(\bar{p}_{k,t}\)满足概率归一化的性质,可以在3至4行之间做个归一化,同时在第3行的计算中不乘\([\det(2\pi R)]^{-\frac{1}{2}}\)这个常数。同样还是为了提高效率,可以将不含常熟系数的、协方差为\(R\)、均值为0的高斯分布打成表。
打表的过程中发现了一个尴尬的事情,就是这里的\(R\)是个奇异矩阵,按照之前的笔记这个时候是整不出二维高斯分布的。。。但是根据上一章使用KF解此题时的分析,不难知道这时候是有一个满足高斯分布的一维随机变量\(\ddot x\sim\mathcal N(0,1)\),\(x\)、\(\dot x\)与\(\ddot x\)之间的关系为:
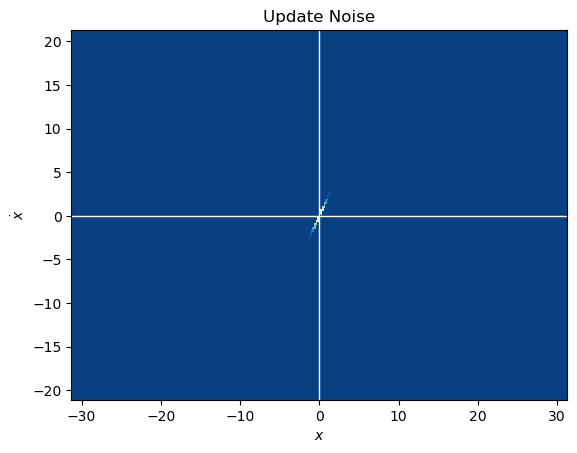
\[\left\{ \begin{aligned} &x_{k+1} = x_{k} + \dot x_k + \frac{1}{2}\ddot x\\ &\dot x_{k+1} = \dot x_k + \ddot x \end{aligned} \right. \]所以更新时其实是在\(\dot x - \dot x_k= 2(x - x_k - \dot x_k)\)这条直线上产生了一个一维高斯分布的噪音,其中心在\((\dot x_k, x_k+\dot x_k)\)处,方差是\(\frac{5}{4}\)。所以其实只要打个在\(y=2x\)这条直线上分布的一维高斯变量的表就好了。至于这根线与栅格的关系,可以看下图,3格为一个周期:

注意到这根直线在每个栅格上留下的线段长度是不一致的,所以一个应该还比较合理的打表方法是:
-
在\(y=2x\)经过的栅格中才赋值,没经过的都是0;
-
赋的值应与【栅格截取\(y=2x\)的线段长度】和【栅格截取\(y=2x\)的线段中点对应的概率密度】之积成正比。
A = np.array([
    [1, 1],
    [0, 1]
])  # 状态转移矩阵

# 获取直方图范围经过状态转移后可能到达的x、dot_x范围
extreme_xy = [0, 0, 0, 0]   # max_x, max_y, min_x, min_y
for x in np.linspace(-RANGE, RANGE, BINS):
    for y in np.linspace(-RANGE, RANGE, BINS):
        dest = np.matmul(A, np.array([[x], [y]]))
        if dest[0, 0] > extreme_xy[0]:
            extreme_xy[0] = dest[0, 0];
        if dest[1, 0] > extreme_xy[1]:
            extreme_xy[1] = dest[1, 0];
        if dest[0, 0] < extreme_xy[2]:
            extreme_xy[2] = dest[0, 0];
        if dest[1, 0] < extreme_xy[3]:
            extreme_xy[3] = dest[1, 0];

# 边上加10是为了避免边上差了几个点
i_max = int((extreme_xy[0] - extreme_xy[2] + 2 * RANGE) / STEP) + 10
j_max = int((extreme_xy[1] - extreme_xy[3] + 2 * RANGE) / STEP) + 10
i_cent = int((-extreme_xy[2] + RANGE) / STEP) + 5
j_cent = int((-extreme_xy[3] + RANGE) / STEP) + 5
noise_mat = np.zeros((i_max, j_max))

idx = 0
di = [1, 0, 0]
dj = [0, 1, 1]
dy = [STEP / 2, 3 * STEP / 4, 3 * STEP / 4]
i = i_cent
j = j_cent + 1
y = 3 / 4 * STEP
noise_mat[i_cent, j_cent] = 1
# 往x+、y+走
while i < i_max and j < j_max:
    noise_mat[i, j] = np.exp(-0.5 * y**2)
    i += di[idx]
    j += dj[idx]
    y += dy[idx]
    idx += 1
    idx %= 3
# 往x-、y-走
idx = 0
i = i_cent
j = j_cent - 1
y = -3 / 4 * STEP
while i > 0 and j > 0:
    noise_mat[i, j] = np.exp(-0.5 * y**2)
    i -= di[idx]
    j -= dj[idx]
    y -= dy[idx]
    idx += 1
    idx %= 3

# 归一化
noise_mat /= np.sum(noise_mat)

x = np.linspace(- i_cent * STEP, (i_max - i_cent) * STEP, i_max)
y = np.linspace(- j_cent * STEP, (j_max - j_cent) * STEP, j_max)
X, Y = np.meshgrid(x, y, indexing='ij') # ij参数使得返回矩阵的大小为len(x)*len(y)
plt.xlabel(r'$x$')
plt.ylabel(r'$\dot{x}$')
plt.title('Update Noise')
plt.gca().axvline(c='w', lw=1)
plt.gca().axhline(c='w', lw=1)
plt.pcolor(X, Y, noise_mat, cmap=plt.cm.GnBu_r)
plt.show()
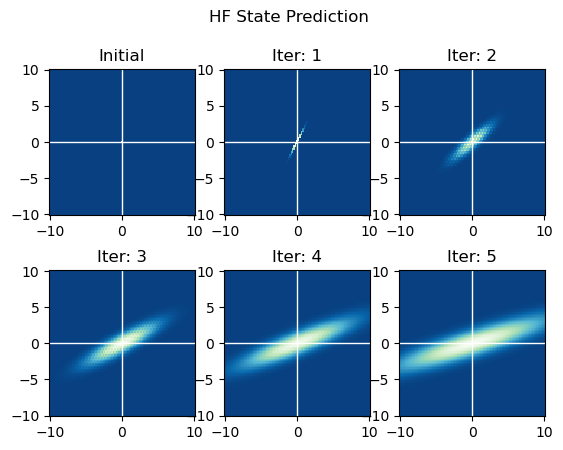
预测时的噪音处理完,状态预测的其他步骤因为是线性变换就好处理多了。接下来首先生成初态,然后迭代。
# 初态
plt.subplot(2, 3, 1).set_title("Initial")
hist, x1_edges, x2_edges = np.histogram2d([0], [0], bins=BINS,
    range=[[-RANGE, RANGE], [-RANGE, RANGE]], density=True)
x1_mesh, x2_mesh = np.meshgrid(x1_edges, x2_edges, indexing='ij')
plt.subplot(2, 3, 1).pcolormesh(x1_mesh, x2_mesh, hist, cmap=plt.cm.GnBu_r)
plt.subplot(2, 3, 1).set_aspect('equal')
plt.subplot(2, 3, 1).axvline(c='w', lw=1)
plt.subplot(2, 3, 1).axhline(c='w', lw=1)

# 迭代5次
for iter in range(1, 6):
    hist_old = hist.copy()
    hist = np.zeros_like(hist_old)
    for i in range(BINS):
        for j in range(BINS):
            # 线性变换
            mean = np.matmul(A, np.array([
                [(i - CENTER) * STEP],
                [(j - CENTER) * STEP]
            ]))
            # 获取在表中的起点索引
            i_mat = i_cent - BINS // 2 + int(np.sign(mean[0, 0]) \
                * ((np.abs(mean[0, 0]) - STEP / 2) // STEP + 1))
            j_mat = j_cent - BINS // 2 + int(np.sign(mean[1, 0]) \
                * ((np.abs(mean[1, 0]) - STEP / 2) // STEP + 1))
            # 直接将表中的数据加上
            hist += hist_old[i, j] \
                * noise_mat[i_mat:i_mat+BINS, j_mat:j_mat+BINS]

    # 归一化,不过注意这里归一化后并不是概率密度,而是落入这一小格的概率
    hist /= np.sum(hist)

    ax = plt.subplot(2, 3, iter+1)
    ax.pcolormesh(x1_mesh, x2_mesh, hist, cmap=plt.cm.GnBu_r)
    ax.set_aspect('equal')
    ax.axvline(c='w', lw=1)
    ax.axhline(c='w', lw=1)
    ax.set_title("Iter: %d"%iter)

plt.suptitle("HF State Prediction")
plt.show()
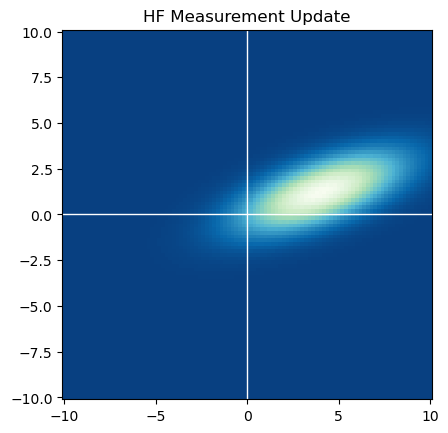
第2问 HF测量更新
hist_old = hist.copy()
hist = np.zeros_like(hist_old)
meas = 5
vari = 10

# 由于只测量了x没测dot_x,所以x相同的每一列将有相同的p(z|x)
for i in range(BINS):
    x1 = (i - CENTER) * STEP
    prob_zx = np.exp(-(x1 - meas) ** 2 / 2 / vari)
    hist[i, :] = prob_zx * hist_old[i, :]

# 归一化
hist /= np.sum(hist)

plt.pcolormesh(x1_mesh, x2_mesh, hist, cmap=plt.cm.GnBu_r)
plt.title("HF Measurement Update")
plt.gca().set_aspect('equal')
plt.gca().axvline(c='w', lw=1)
plt.gca().axhline(c='w', lw=1)
plt.show()
第二题
第1问 HF状态预测
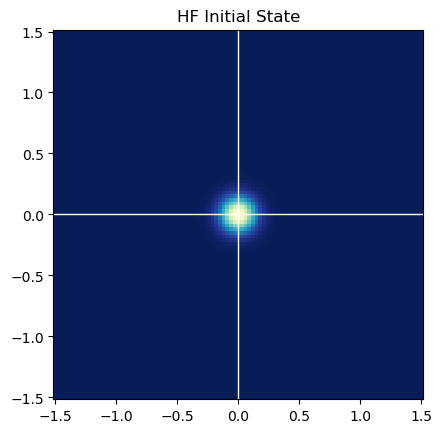
初始状态下角度的方差太大了,可以近似当成均匀分布算。同时因为这个问题只问了一次状态预测和一次不包含角度的测量更新,所以偷个懒就直接不考虑角度变量,则状态空间就剩\(x\)和\(y\)了。
BINS = 101
STEP = 0.03
CENTER = BINS // 2
RANGE = STEP / 2 + BINS // 2 * STEP

hist = np.ones((BINS, BINS))

# x、y符合均值为0、方差为0.01的、相互独立的高斯分布
for i in range(BINS):
    x = (i - CENTER) * STEP
    hist[i, :] *= np.exp(- x**2 / 2 / 0.01)
for j in range(BINS):
    y = (j - CENTER) * STEP
    hist[:, j] *= np.exp(- y**2 / 2 / 0.01)

_, x_edges, y_edges = np.histogram2d([0], [0], bins=BINS,
    range=[[-RANGE, RANGE], [-RANGE, RANGE]], density=True)

x_mesh, y_mesh = np.meshgrid(x_edges, y_edges, indexing='ij')
plt.title("HF Initial State")
plt.pcolormesh(x_mesh, y_mesh, hist, cmap=plt.cm.YlGnBu_r)
plt.gca().set_aspect('equal')
plt.gca().axvline(c='w', lw=1)
plt.gca().axhline(c='w', lw=1)
plt.show()
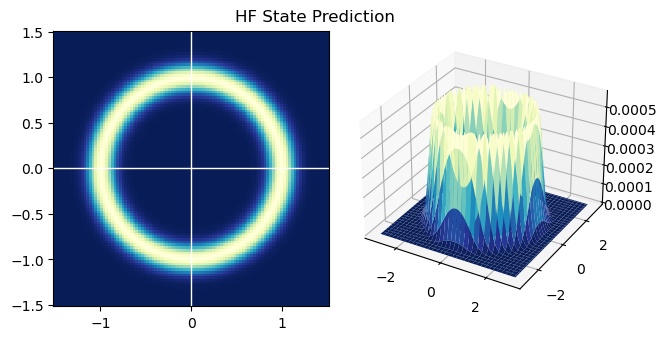
先实现一下状态预测模型,这个问题中如果先验的状态(\(x\)、\(y\),不包含\(\theta\))是确定的,则后验状态应该均匀地分布在以原状态为圆心且半径为1的圆周上。在直方图滤波中,需要把这个圆周上的分布栅格化,最符合直觉的方法,即是圆周覆盖到的栅格中的概率密度与落在栅格中的圆周的长度成正比。再近似一下,因为每一格都很小,所以栅格对应的圆周角也是小角,用圆弧与栅格的交点的连线直接代替圆弧长度精度也大差不差。参考pptacher的图说明一下:
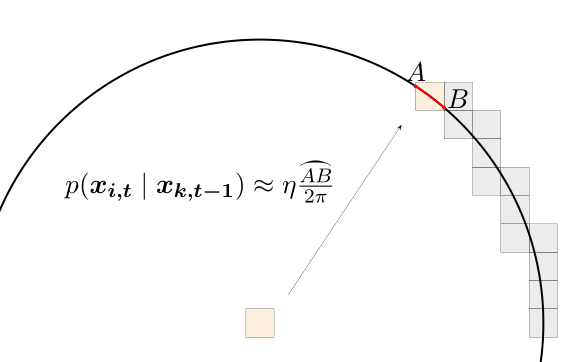
因为对BINSxBINS的每一个小格都要进行这个圆周操作,所以一个较快的方法仍是先将分布打成表格。
quarter = int(np.ceil(1 / STEP))
size = 2 * quarter + 1
update_distri = np.zeros((size, size))

update_distri[0, quarter] = update_distri[quarter, 0]\
    = update_distri[size-1, quarter] = update_distri[quarter, size-1] = STEP

for i in range(quarter):
    x_min = (i - quarter) * STEP - STEP / 2
    x_max = x_min + STEP
    for j in range(quarter):
        y_min = (j - quarter) * STEP - STEP / 2
        y_max = y_min + STEP
        if not (x_min**2 + y_min**2 > 1 and x_max**2 + y_max**2 < 1):
            continue
        xMym = x_max**2 + y_min**2 > 1
        xmyM = x_min**2 + y_max**2 > 1
        # 一个小格子有4条边,拿笔画一画会发现圆弧与他们相较可分为4种情况
        if (not xMym) and (not xmyM):
            x1 = x_min
            y1 = -np.sqrt(1 - x_min**2)
            x2 = -np.sqrt(1 - y_min**2)
            y2 = y_min
        elif (not xMym) and xmyM:
            x1 = -np.sqrt(1 - y_min**2)
            y1 = y_min
            x2 = -np.sqrt(1 - y_max**2)
            y2 = y_max
        elif xMym and (not xmyM):
            x1 = x_min
            y1 = -np.sqrt(1 - x_min**2)
            x2 = x_max
            y2 = -np.sqrt(1 - x_max**2)
        else:
            x1 = x_max
            y1 = -np.sqrt(1 - x_max**2)
            x2 = -np.sqrt(1 - y_max**2)
            y2 = y_max
        dist = np.sqrt((x1 - x2)**2 + (y1 - y2)**2)
        # 因为对称所以直接赋值
        update_distri[i, j] = update_distri[size-1-i, j] \
            = update_distri[i, size-1-j] = update_distri[size-1-i, size-1-j] \
                = dist

# 归一化,其实不归一化也行,因为后边还要归一化
update_distri /= np.sum(update_distri)

fig = plt.figure()
ax = fig.add_subplot(projection='3d')
x = np.linspace(- quarter * STEP, quarter * STEP, size)
y = np.linspace(- quarter * STEP, quarter * STEP, size)
X, Y = np.meshgrid(x, y, indexing='ij')
ax.set_title("Circle Distribution")
ax.plot_surface(X, Y, update_distri, cmap=plt.cm.YlGnBu_r)
plt.show()
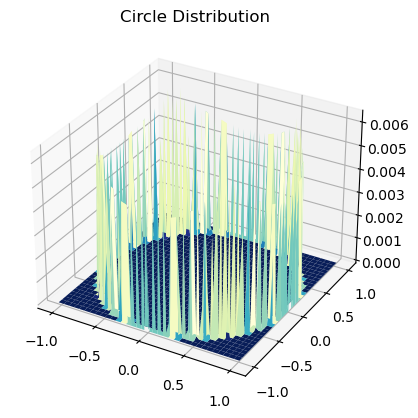
接下来即可进行状态预测。
hist_old = hist.copy()
hist = np.zeros_like(hist_old)

def get_offset(idx):
    ''' 得到切片偏移量,要多这一步是因为靠边(绝对值接近RANGE)的点更新会跑到直方图外边去,这些要丢掉 '''
    if idx - quarter < 0:
        sub = -idx
        add = quarter+1
    elif idx + quarter >= BINS-1:
        sub = -quarter
        add = BINS - idx
    else:
        sub = -quarter
        add = quarter+1
    return sub, add

for i in range(BINS):
    for j in range(BINS):
        # 和第一题一样,获得索引后直接查表取对应部分加上就好
        i_sub, i_add = get_offset(i)
        j_sub, j_add = get_offset(j)
        hist[i+i_sub:i+i_add, j+j_sub:j+j_add] += hist_old[i, j] \
            * update_distri[quarter+i_sub:quarter+i_add, quarter+j_sub:quarter+j_add]

# 归一化
hist /= np.sum(hist)

fig = plt.figure()

ax1 = fig.add_subplot(121)
ax1.pcolormesh(x_mesh, y_mesh, hist, cmap=plt.cm.YlGnBu_r)
ax1.set_aspect('equal')
ax1.axvline(c='w', lw=1)
ax1.axhline(c='w', lw=1)

ax2 = fig.add_subplot(122, projection='3d')
x = np.linspace(- 100 * STEP, 100 * STEP, BINS)
y = np.linspace(- 100 * STEP, 100 * STEP, BINS)
X, Y = np.meshgrid(x, y)
ax2.plot_surface(X, Y, hist, cmap=plt.cm.YlGnBu_r)

fig.suptitle("HF State Prediction", y=0.8)
fig.tight_layout()
plt.show()
第2问 HF测量更新
hist_old = hist.copy()
hist = np.zeros_like(hist_old)
meas = 0.8
vari = 0.01

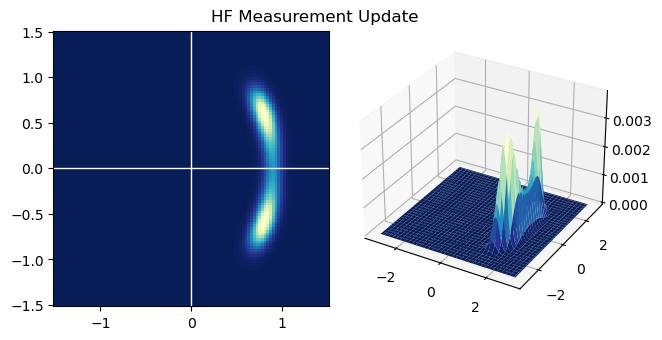
# 测量更新,同样因为测量值只有一个维度的,直接整列整列地更新就好
for i in range(BINS):
    x = (i - CENTER) * STEP
    prob_zx = np.exp(-(x - meas) ** 2 / 2 / vari)
    hist[i, :] = prob_zx * hist_old[i, :]

# 归一化
hist /= np.sum(hist)

# 绘制结果
fig = plt.figure()

ax1 = fig.add_subplot(121)
ax1.pcolormesh(x_mesh, y_mesh, hist, cmap=plt.cm.YlGnBu_r)
ax1.set_aspect('equal')
ax1.axvline(c='w', lw=1)
ax1.axhline(c='w', lw=1)

ax2 = fig.add_subplot(122, projection='3d')
x = np.linspace(- 100 * STEP, 100 * STEP, BINS)
y = np.linspace(- 100 * STEP, 100 * STEP, BINS)
X, Y = np.meshgrid(x, y, indexing='ij')
ax2.plot_surface(X, Y, hist, cmap=plt.cm.YlGnBu_r)

fig.suptitle("HF Measurement Update", y=0.8)
fig.tight_layout()
plt.show()
第三题
\[\begin{aligned} 1:\quad&\textbf{Algorithm Particle\_filter(}\mathcal X_{t-1},u_t,z_t\textbf{):}\\ 2:\quad&\quad\bar{\mathcal X}_{t}=\mathcal X_{t}=\emptyset\\ 3:\quad&\quad\text{for}\ m=1\ \text{to}\ M\ \text{do}\\ 4:\quad&\quad\quad\text{sample}\ x_t{[m]}\sim p(x_t\mid u_t,x_{t-1}^{[m]})\\ 5:\quad&\quad\quad w_t^{[m]}=p(z_t\mid x_t^{[m]})\\ 6:\quad&\quad\quad \bar{\mathcal X}_{t}=\bar{\mathcal X}_{t}+\langle x_t^{[m]},w_t^{[m]}\rangle\\ 7:\quad&\quad \text{endfor}\\ 8:\quad&\quad\text{for}\ m=1\ \text{to}\ M\ \text{do}\\ 9:\quad&\quad\quad\text{draw}\ i\ \text{with probability}\propto w_t^{[i]}\\ 10:\quad&\quad\quad\text{add}\ x_t^{[i]}\ \text{to}\ \mathcal X_t\\ 11:\quad&\quad \text{endfor}\\ 12:\quad&\quad\text{return}\ \mathcal X_t \end{aligned} \]本题问粒子滤波如果只有两个粒子会如何对后验估计产生偏差,顺着书里介绍“一个粒子造成偏差”的角度回答一下这个问题。
两个粒子的情况下,很容易在粒子滤波的第一步3~7行采出两个一模一样的粒子,而一样的粒子就又会导致8~11行的测量更新失效。所以假如状态更新对一个错误的状态有了较大的估计,那么3~7行很可能一个正确的粒子都采不出,测量也就一直无法进行纠正。两个粒子有这个问题,粒子稍微多一点,但仍然很少时,依旧会有这个问题。
换个角度,就直觉上来说只要想观察这种随机的东西,就得采样次数够多才能靠近真实分布,两个实在太少了。但不知道题目问粒子数为2个,是不是因为在2个时存在一些特有的问题?但即使有感觉实际意义也不大,因为一般不会只用2个吧。
第四题
第1问 PF状态预测
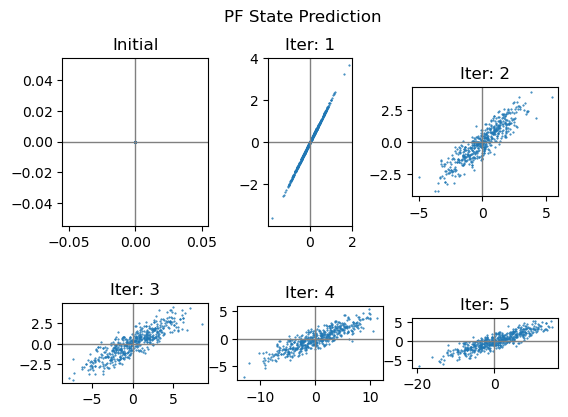
相比直方图滤波,粒子滤波实现起来就简单多了。
M = 500
A = np.array([
    [1, 1],
    [0, 1]
])
noise_mean = 0
noise_std_var = np.sqrt(1)

def pf_predict(p_set):
    ''' 按照状态预测模型更新粒子集 '''
    global A, noise_mean, noise_std_var
    new_set = []
    for p in p_set:
        new_p = np.matmul(A, p)
        noise = np.random.normal(noise_mean, noise_std_var)
        new_p += np.array([
            [0.5 * noise],
            [noise]
        ])
        new_set.append(new_p)
    return np.array(new_set)
# 生成初态,初态确定就在原点,所以所有粒子都在原点
cur_set = np.zeros((M, 2, 1))

ax = plt.subplot(231)
ax.scatter(cur_set[:, 0, :], cur_set[:, 1, :], 1, marker='.')
ax.axvline(c='grey', lw=1)
ax.axhline(c='grey', lw=1)
ax.set_title("Initial")

# 迭代5次
for iter in range(1, 6):
    old_set = cur_set.copy()
    cur_set = pf_predict(old_set)
    ax = plt.subplot(2, 3, iter+1)
    ax.set_aspect('equal')
    ax.scatter(cur_set[:, 0, :], cur_set[:, 1, :], 1, marker='.')
    ax.axvline(c='grey', lw=1)
    ax.axhline(c='grey', lw=1)
    ax.set_title("Iter: %d" % iter)

plt.suptitle("PF State Prediction")
plt.show()
第2问 PF测量更新
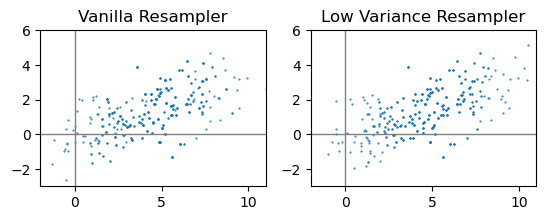
看到书里称最基本的粒子滤波器为“vanilla particle filter”(香草粒子滤波器?),查了下发现这是计算机软硬件领域、算法领域的一个俗语,这里的vanilla指的不是香草,而是指某种软硬件或者算法处于没有经过修改的原本形式,也就是基本款嘛。
def gen_weight_sum(p_set, z, var):
    '''
    根据测量模型得到每个粒子重采样的权重,
    并将权重依次相加记录,方便后续采样
    '''
    w_sum = [0]
    for p in p_set:
        w_sum.append(np.exp(-(z-p[0, 0])**2 / var) + w_sum[-1])
    w_sum = np.array(w_sum)
    w_sum /= w_sum[-1]

    return w_sum

def vanilla_resampler(p_set, z, w_sum):
    ''' 基本重采样器 '''
    new_set = []
    for i in range(M):
        pos = np.random.rand()
        # 使用二分查找确定采样点
        idx_l, idx, idx_h = 0, M // 2, M
        while True:
            if w_sum[idx] <= pos:
                idx_l = idx
                idx = (idx_h + idx_l) // 2
            elif w_sum[idx] > pos:
                if w_sum[idx-1] <= pos:
                    break
                else:
                    idx_h = idx
                    idx = (idx_h + idx_l) // 2
            if idx_l + 1 == idx_h:
                break
        new_set.append(p_set[idx-1])    # -1是因为w开头是0

    return np.array(new_set)

def low_var_sampler(p_set, z, w_sum):
    ''' 低variance(在这里不是指方差,而是表示变异、偏差等意思)重采样器 '''
    new_set = []
    refer = np.random.rand() / M
    step = 1 / M
    idx = 0
    for i in range(M):
        while w_sum[idx] < refer:
            idx += 1
        new_set.append(p_set[idx-1])
        refer += step

    return np.array(new_set)
meas = 5
meas_var = 10
w_sum = gen_weight_sum(cur_set, meas, meas_var)

vanilla_set = vanilla_resampler(cur_set, meas, w_sum)
ax = plt.subplot(1, 2, 1)
ax.set_aspect('equal')
ax.scatter(vanilla_set[:, 0, :], vanilla_set[:, 1, :], 1, marker='.')
ax.axvline(c='grey', lw=1)
ax.axhline(c='grey', lw=1)
ax.set_xlim(-2, 11)
ax.set_ylim(-3, 6)
ax.set_title("Vanilla Resampler")

low_var_set = low_var_sampler(cur_set, meas, w_sum)
ax = plt.subplot(1, 2, 2)
ax.set_aspect('equal')
ax.scatter(low_var_set[:, 0, :], low_var_set[:, 1, :], 1, marker='.')
ax.axvline(c='grey', lw=1)
ax.axhline(c='grey', lw=1)
ax.set_xlim(-2, 11)
ax.set_ylim(-3, 6)
ax.set_title("Low Variance Resampler")

plt.show()
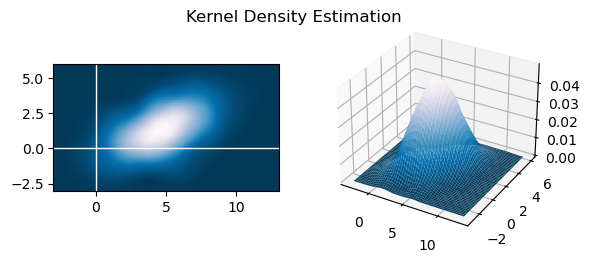
书上介绍过,核密度估计(Kernel Density Estimation, KDE)是从粒子滤波中重新估计概率密度函数的方法之一,其对概率密度的估计如下:
\[\hat f(x)=\frac{1}{nh}\sum\limits_{i=1}^nK(\frac{x-x_i}{h}) \]其中,\(h\)是一个可以调整改变效果的参数,\(n\)是\(x\)的维数,\(K(x)\)可以取为Epanechnikov核函数:
\[K_E(x)= \left\{ \begin{aligned} &\frac{d+2}{2c_d}(1-x^Tx)&\text{if}\ x^Tx\le1\\ &0\quad&\text{otherwise} \end{aligned} \right. \]现在就来做一下KDE:
KDE_h = 2
GRID = 300

x = np.linspace(-3, 13, GRID)
y = np.linspace(- 3, 6, GRID)
X, Y = np.meshgrid(x, y)

# 使用Epanechnikov核函数
in_mesh = np.array([X.flatten(), Y.flatten()])  # in_mesh: 2 * (GRID^2)
kde_2 = np.zeros((GRID, GRID))
for p in low_var_set:   # p: 2 * 1
    kvar = (in_mesh - p) / KDE_h    # kvar: 2 * (GRID^2)
    squ = np.sum(kvar * kvar, 0)    # squ: (GRID^2)
    squ = squ.reshape(GRID, GRID)   # squ: GRID * GRID
    kde_2 += (1 - squ) * (squ < 1)  # kde_2: GRID * GRID

# 公式中的系数,乘上之后即可得概率密度
kde_2 /= 0.5 * np.pi * M * KDE_h**2

fig = plt.figure()
fig.suptitle("Kernel Density Estimation", y=0.74)

ax1 = fig.add_subplot(121)
ax1.pcolor(X, Y, kde_2, cmap=plt.cm.PuBu_r)
ax1.set_aspect('equal')
ax1.axvline(c='w', lw=1)
ax1.axhline(c='w', lw=1)

ax2 = fig.add_subplot(1, 2, 2, projection='3d')
ax2.plot_surface(X, Y, kde_2, cmap=plt.cm.PuBu_r)

plt.show()
第五题
第1问 PF状态预测
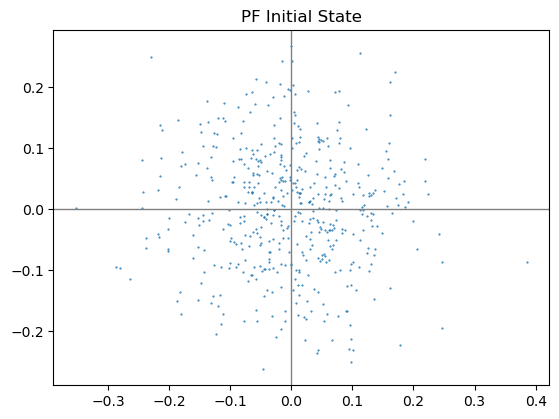
首先生成初始的粒子集。
M = 500

cur_set = []

for m in range(M):
    # 两个方向独立分布,均值0,标准差0.1
    p = np.random.normal(0, 0.1, (2, 1))
    cur_set.append(p)

cur_set = np.array(cur_set)

plt.scatter(cur_set[:, 0, :], cur_set[:, 1, :], 1, marker='.')
ax = plt.gca()
ax.set_aspect('equal')
ax.axvline(c='grey', lw=1)
ax.axhline(c='grey', lw=1)

plt.title("PF Initial State")
plt.show()
def pf_predict(p_set):
    ''' 粒子滤波状态预测 '''
    new_set = []
    for p in p_set:
        # 仍然因为角度方差太大,假设角度符合均匀分布
        theta = np.random.uniform(-np.pi, np.pi)
        new_set.append(np.array([
            [p[0, 0] + np.cos(theta)],
            [p[1, 0] + np.sin(theta)]
        ]))
    return np.array(new_set)
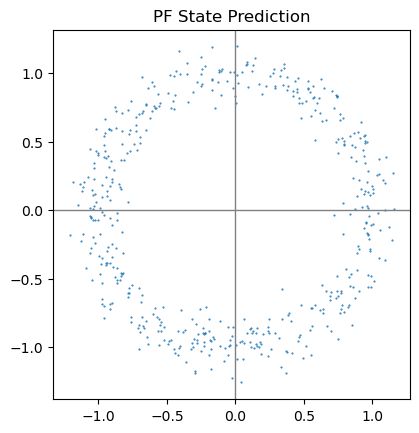
cur_set = pf_predict(cur_set)

plt.scatter(cur_set[:, 0, :], cur_set[:, 1, :], 1, marker='.')
ax = plt.gca()
ax.set_aspect('equal')
ax.axvline(c='grey', lw=1)
ax.axhline(c='grey', lw=1)

plt.title("PF State Prediction")
plt.show()
第2问 PF测量更新
直接使用上一题中实现的函数即可
meas = 0.8
meas_var = 0.01
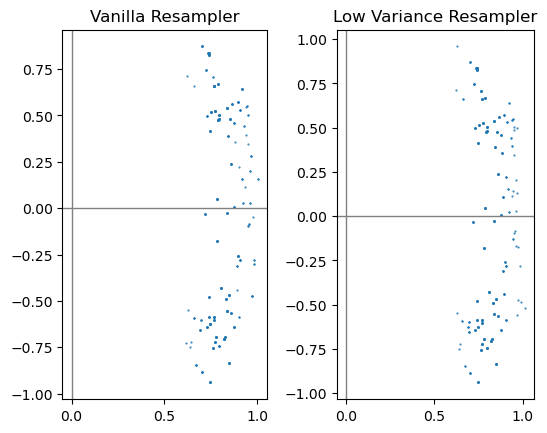
w_sum = gen_weight_sum(cur_set, meas, meas_var)
vanilla_set = vanilla_resampler(cur_set, meas, w_sum)
ax = plt.subplot(1, 2, 1)
ax.set_aspect('equal')
ax.scatter(vanilla_set[:, 0, :], vanilla_set[:, 1, :], 1, marker='.')
ax.axvline(c='grey', lw=1)
ax.axhline(c='grey', lw=1)
ax.set_title("Vanilla Resampler")

low_var_set = low_var_sampler(cur_set, meas, w_sum)
ax = plt.subplot(1, 2, 2)
ax.set_aspect('equal')
ax.scatter(low_var_set[:, 0, :], low_var_set[:, 1, :], 1, marker='.')
ax.axvline(c='grey', lw=1)
ax.axhline(c='grey', lw=1)
ax.set_title("Low Variance Resampler")

plt.show()
最后也再用低Variance(我不知道怎么翻译合适
标签:set,机器人,hist,STEP,plt,课后,np,ax,习题 From: https://www.cnblogs.com/harold-lu/p/16746398.html