Grafana官网
下载Grafana
[root@VM-24-9-centos Prometheus_server]# wget https://dl.grafana.com/oss/release/grafana-9.3.2.linux-amd64.tar.gz
安装Grafana
[root@VM-24-9-centos Prometheus_server]# tar -zxvf grafana-9.3.2.linux-amd64.tar.gz
[root@VM-24-9-centos Prometheus_server]# cd grafana-9.3.2/bin
# 启动Grafana
[root@VM-24-9-centos bin]# nohup ./grafana-server &
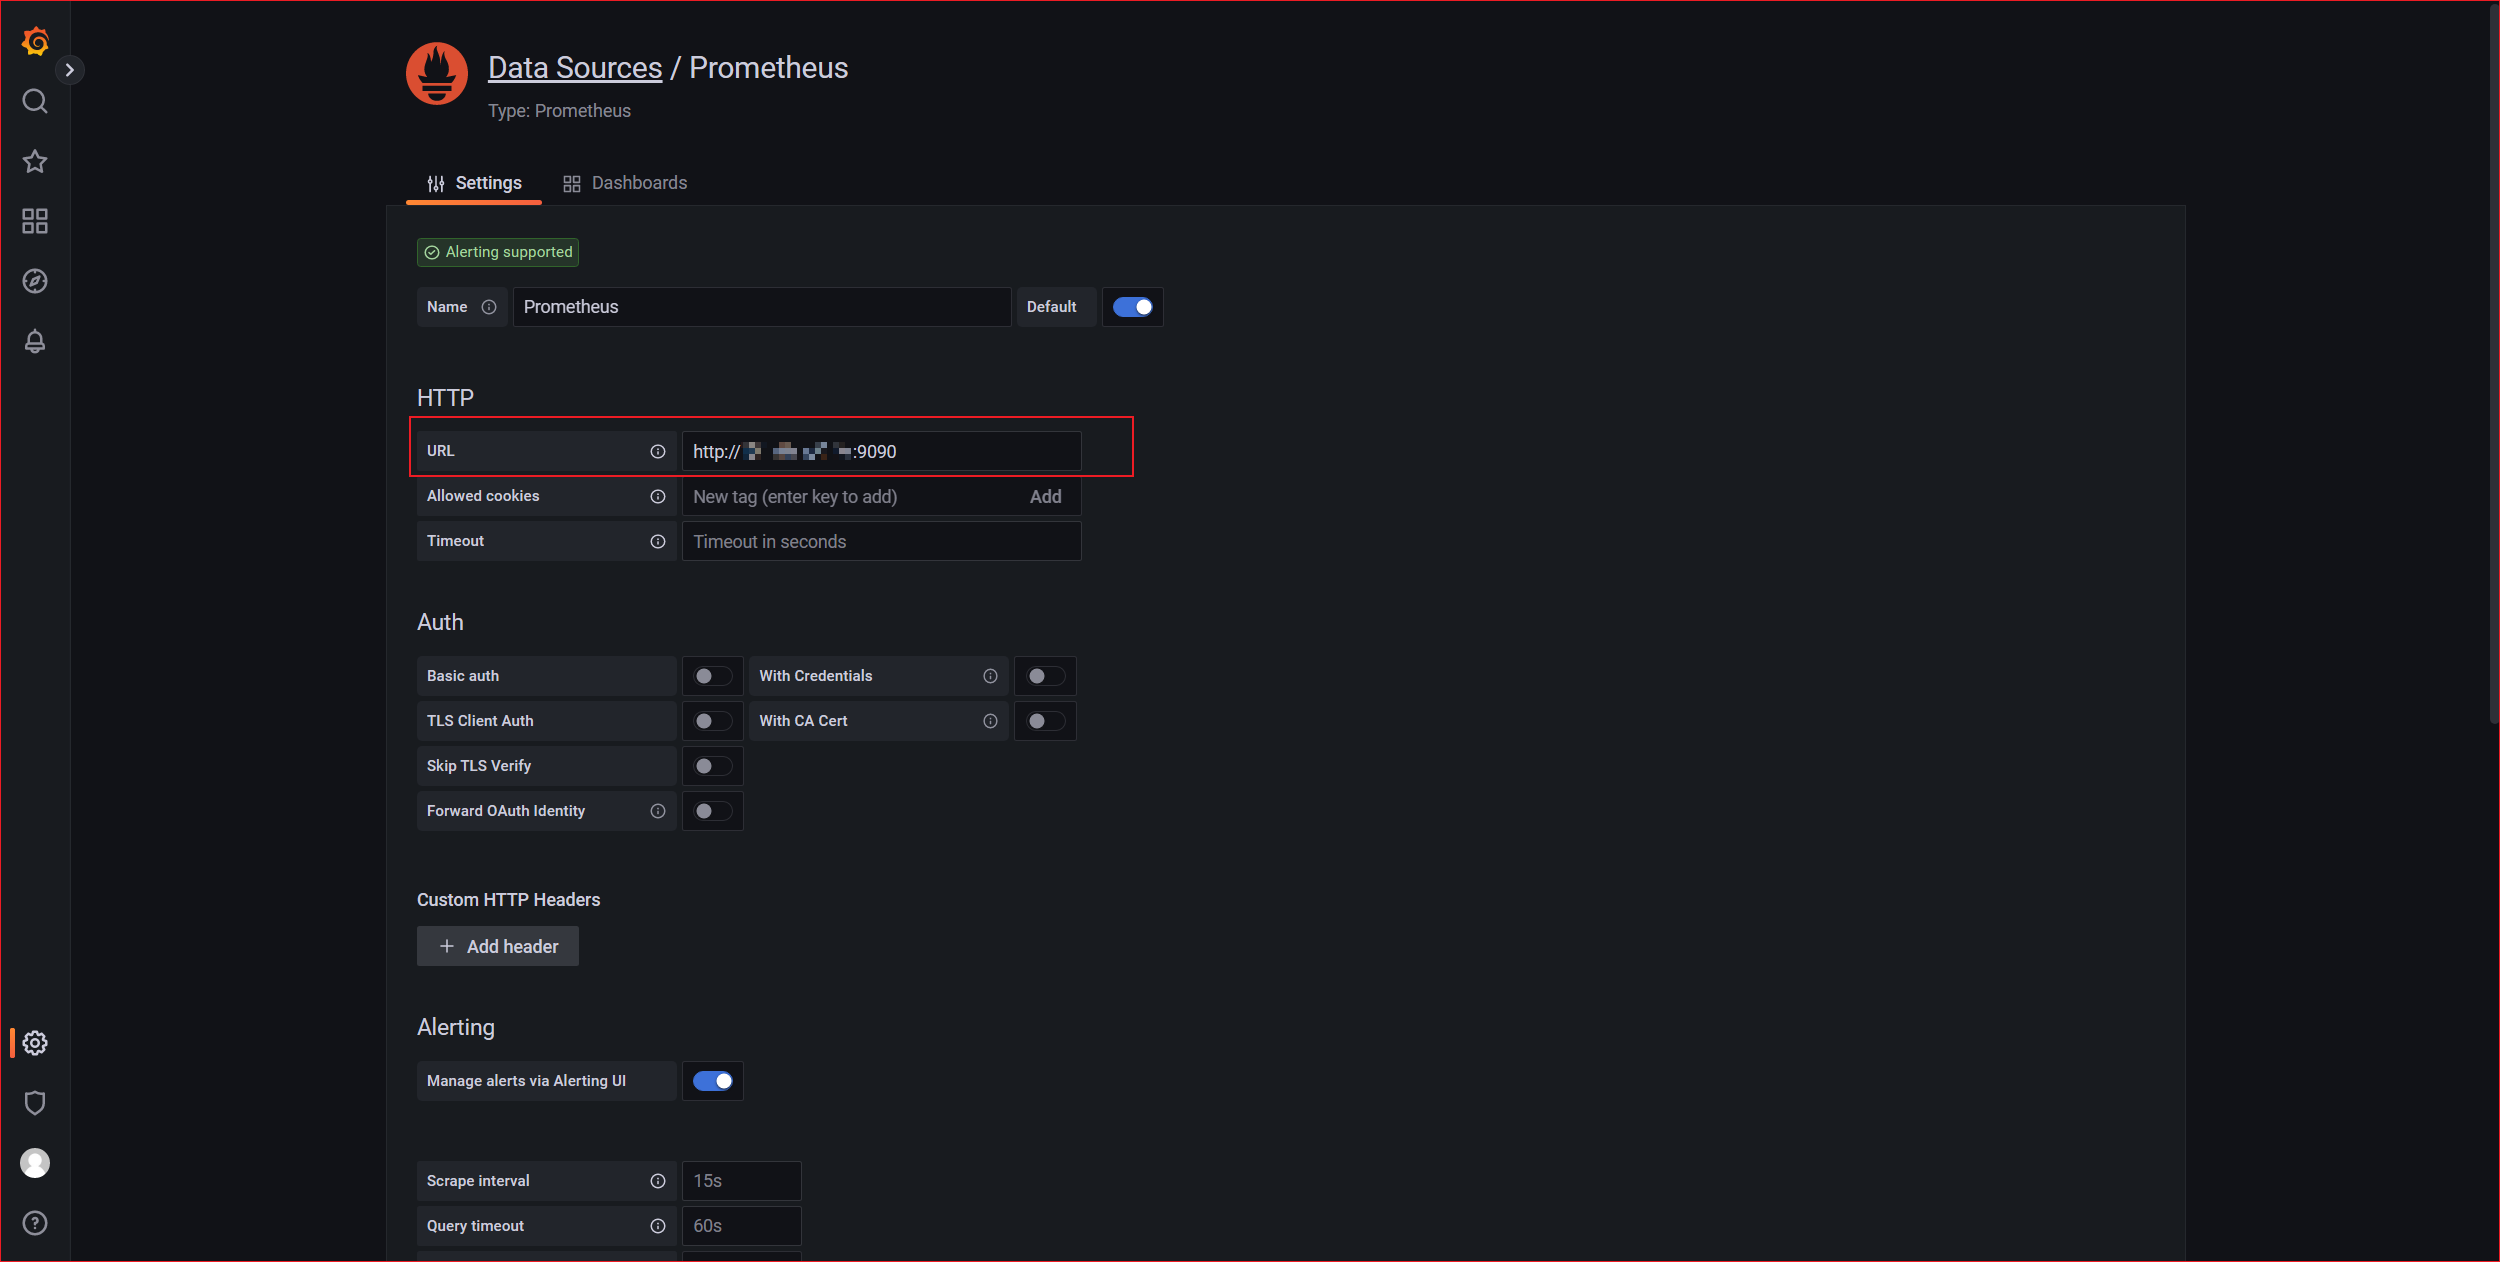
配置Grafana
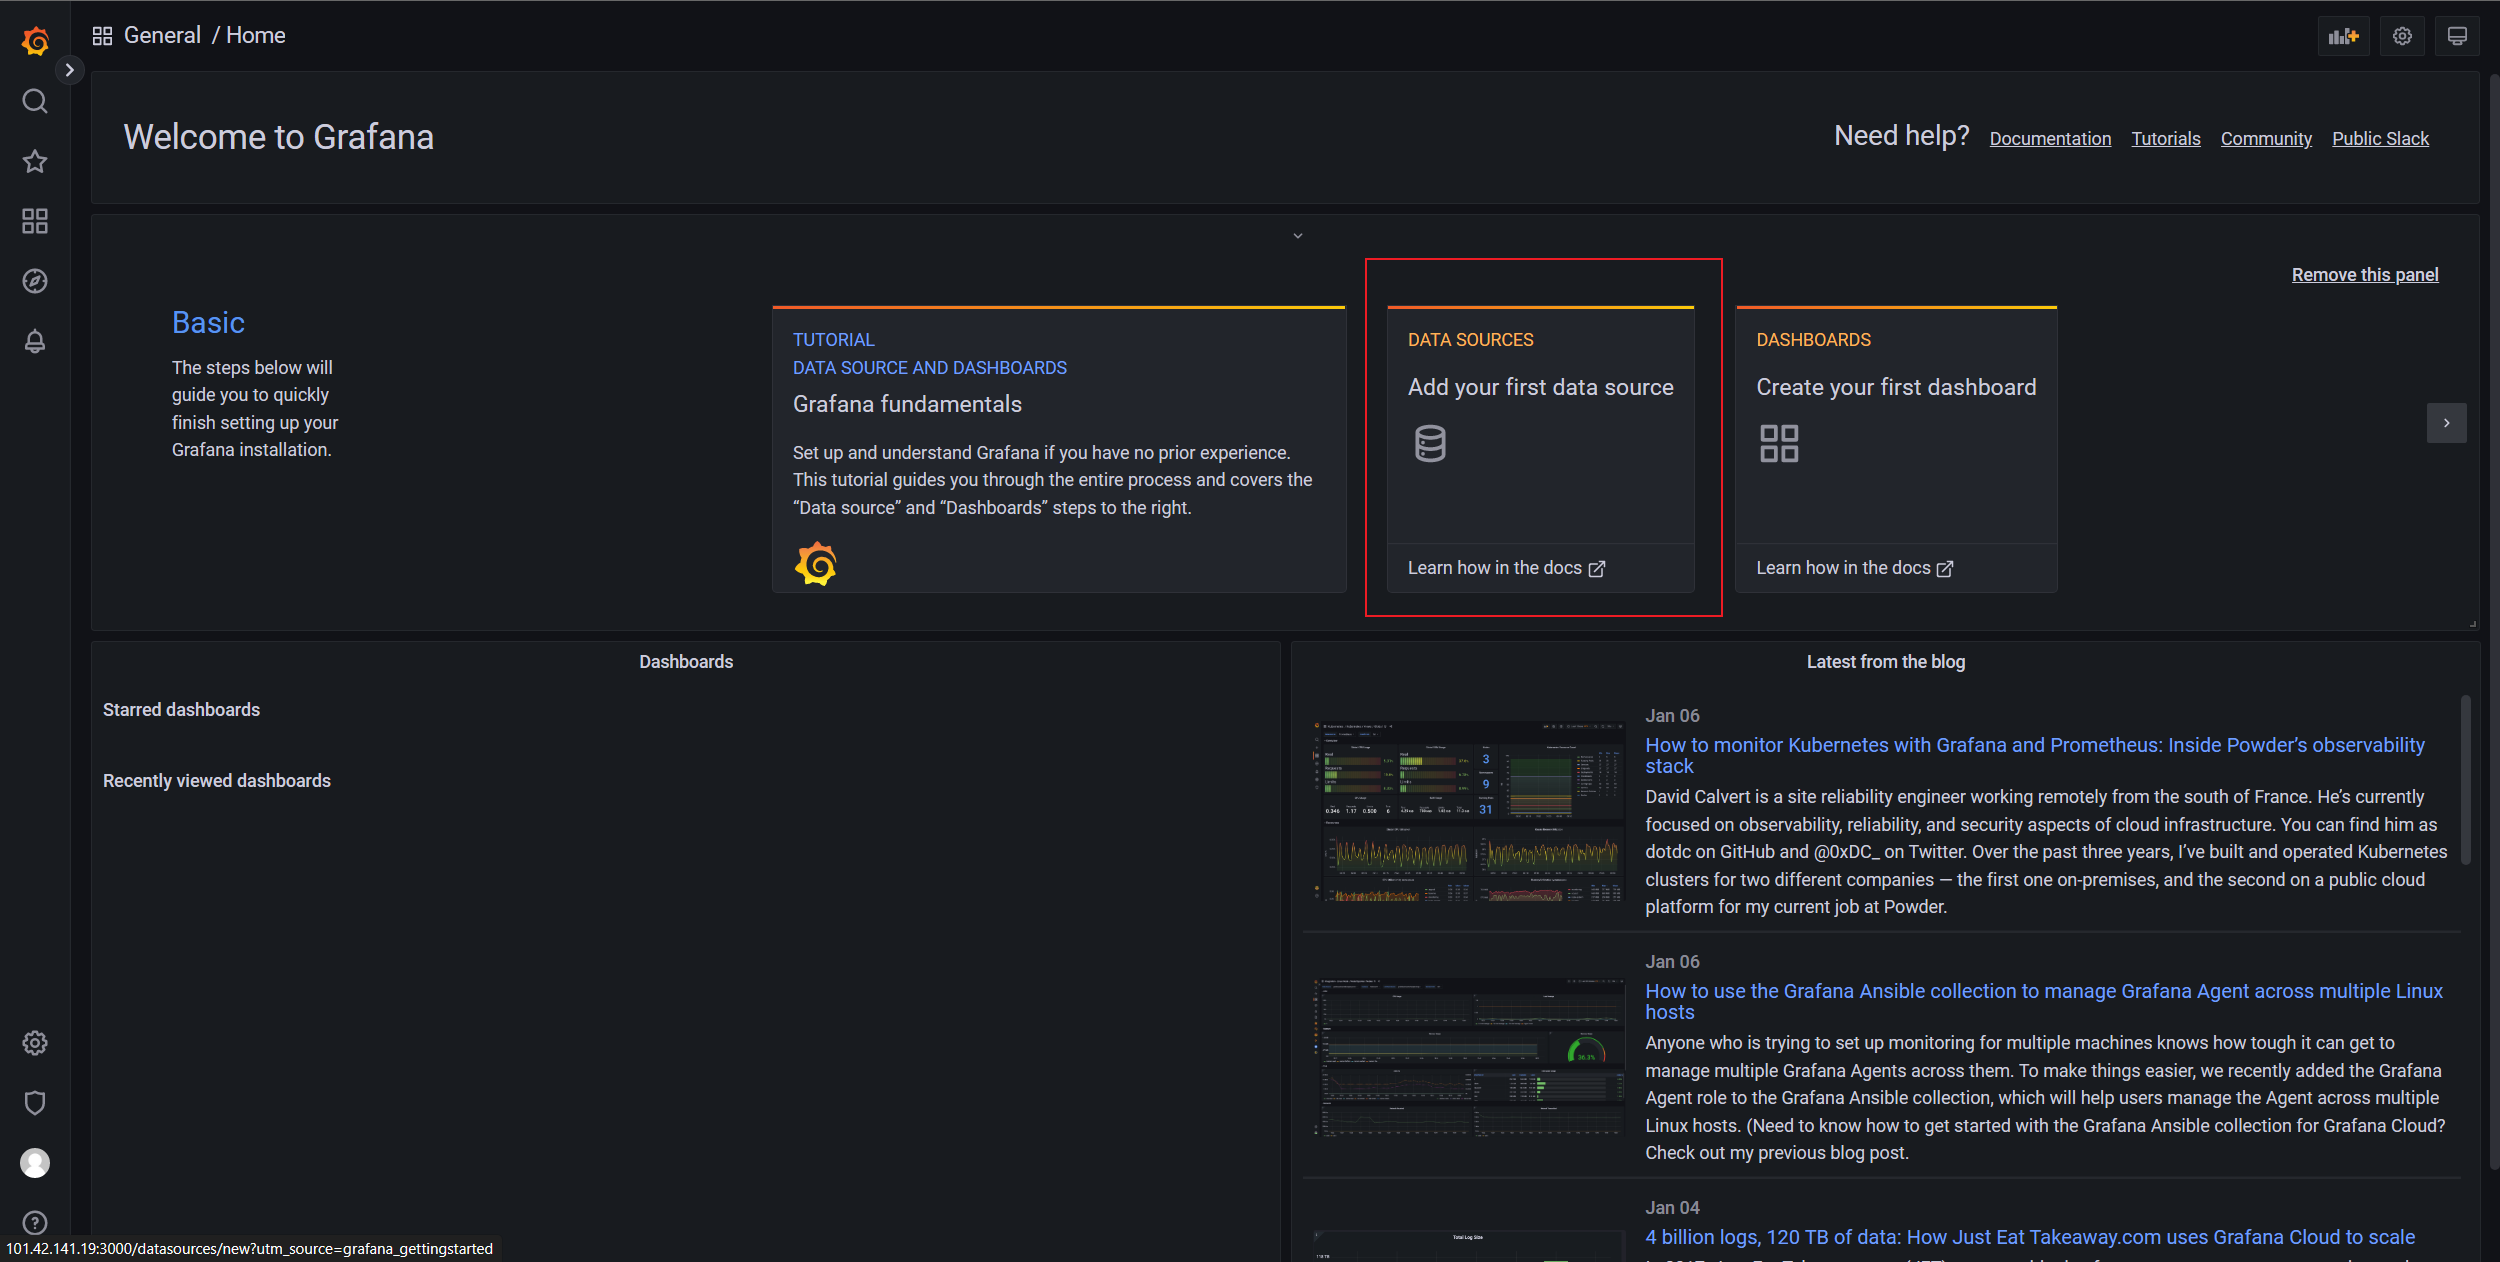
端口默认3000,访问地址 localhost:3000,默认账号密码 admin/admin
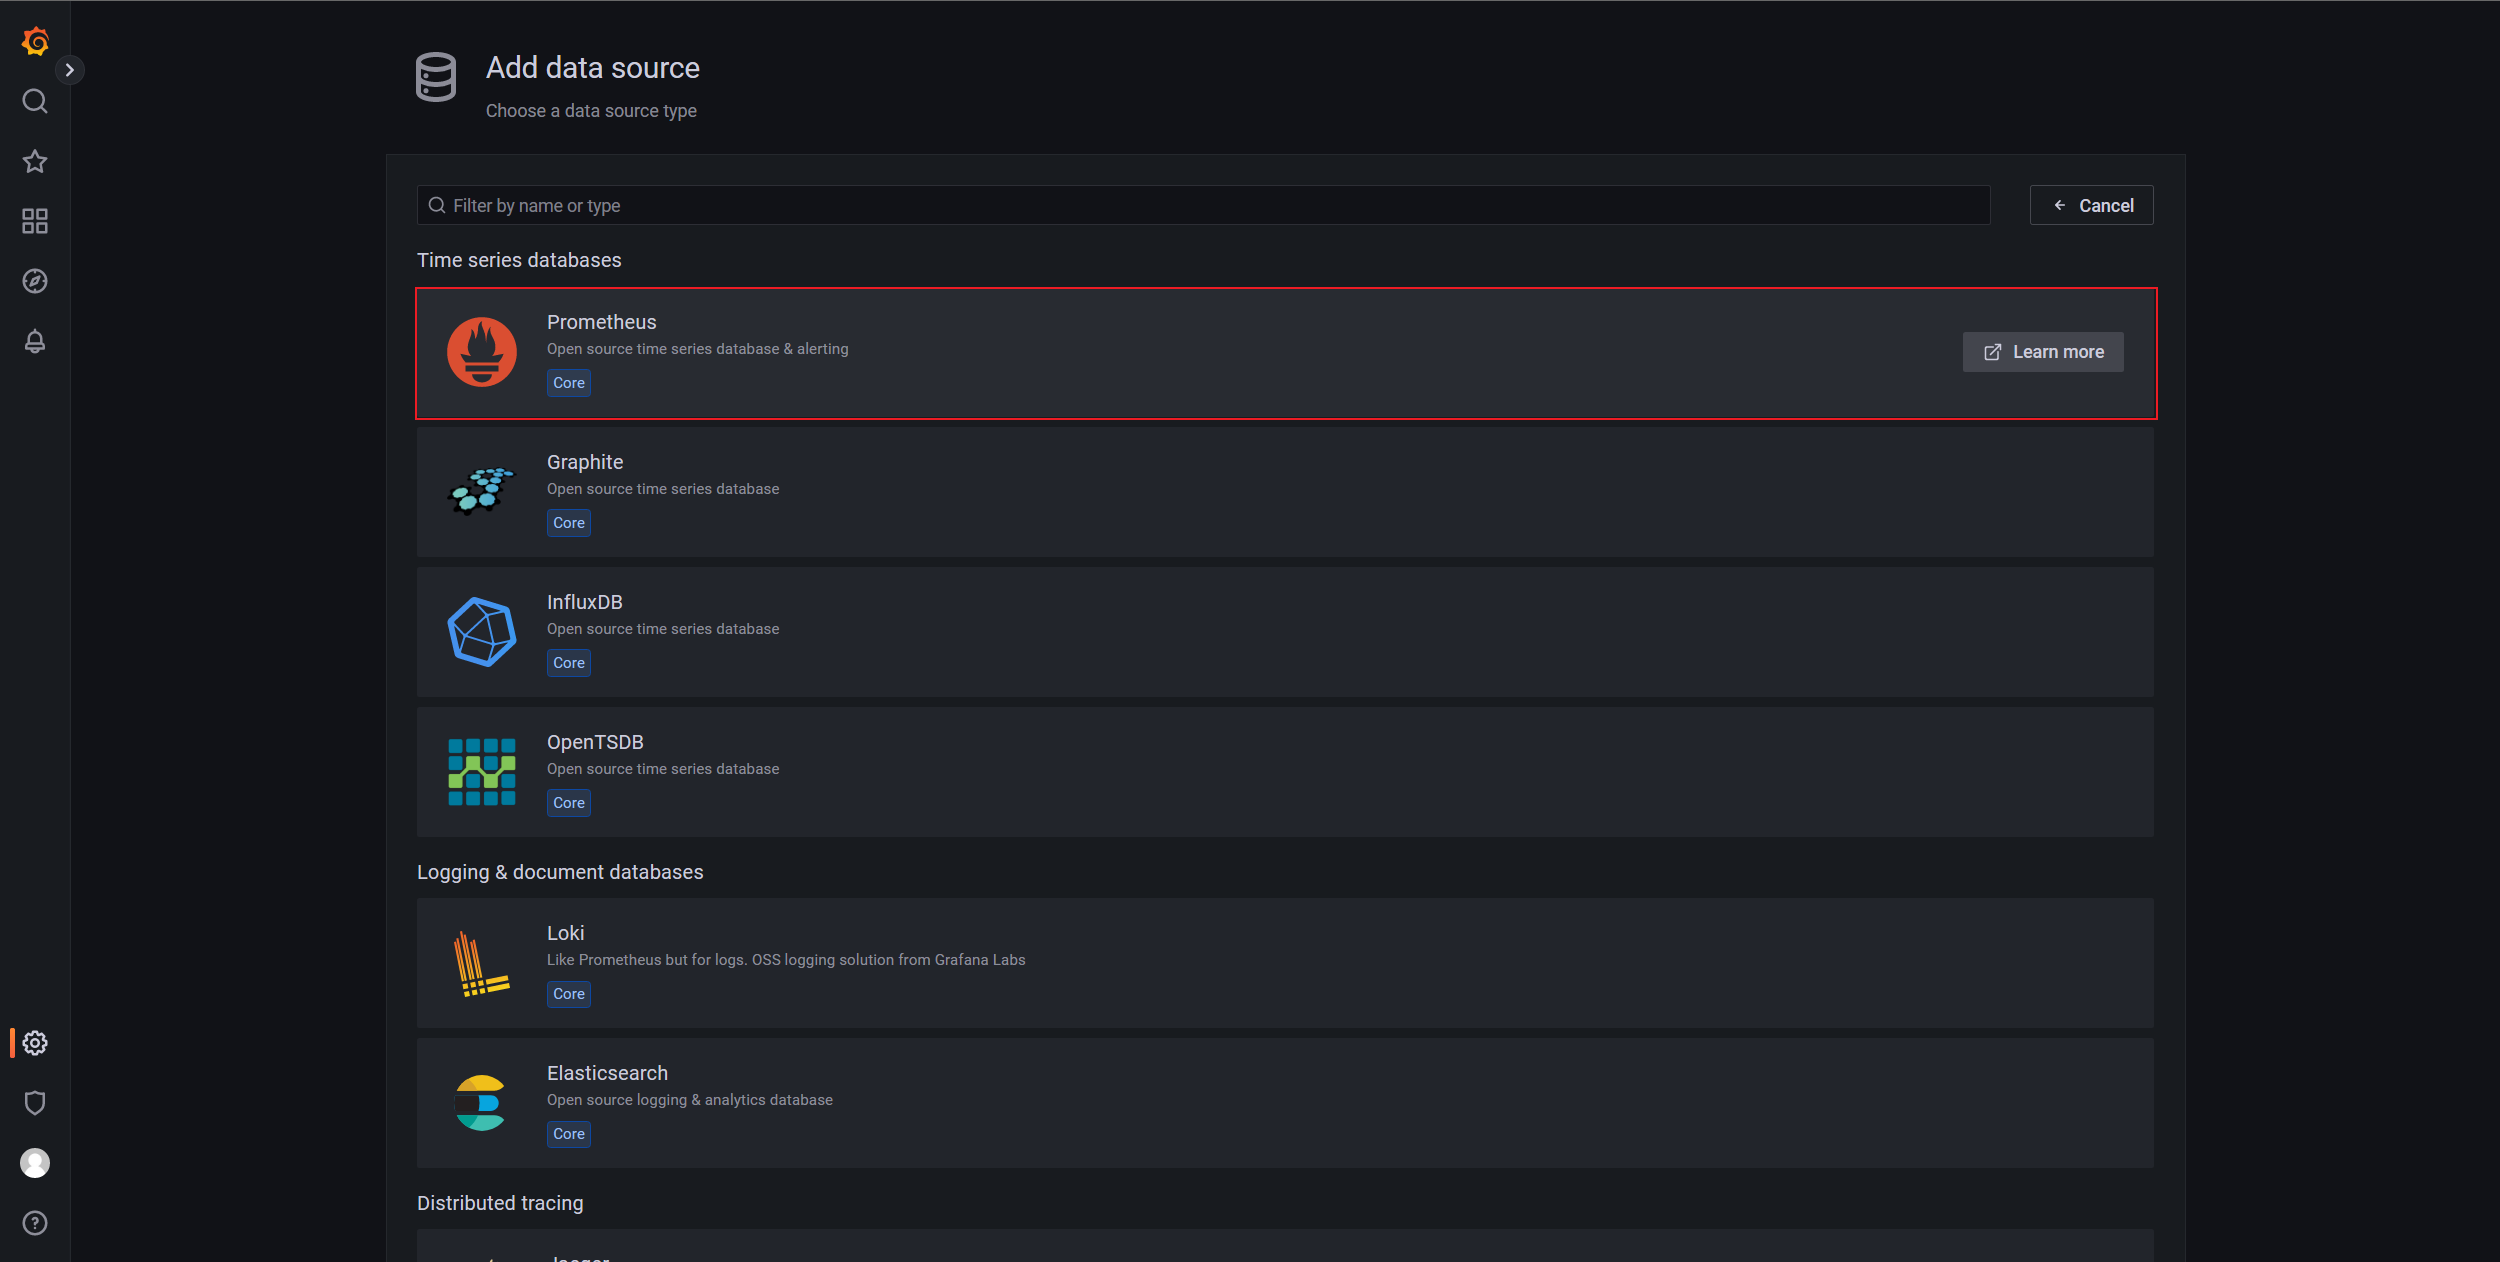
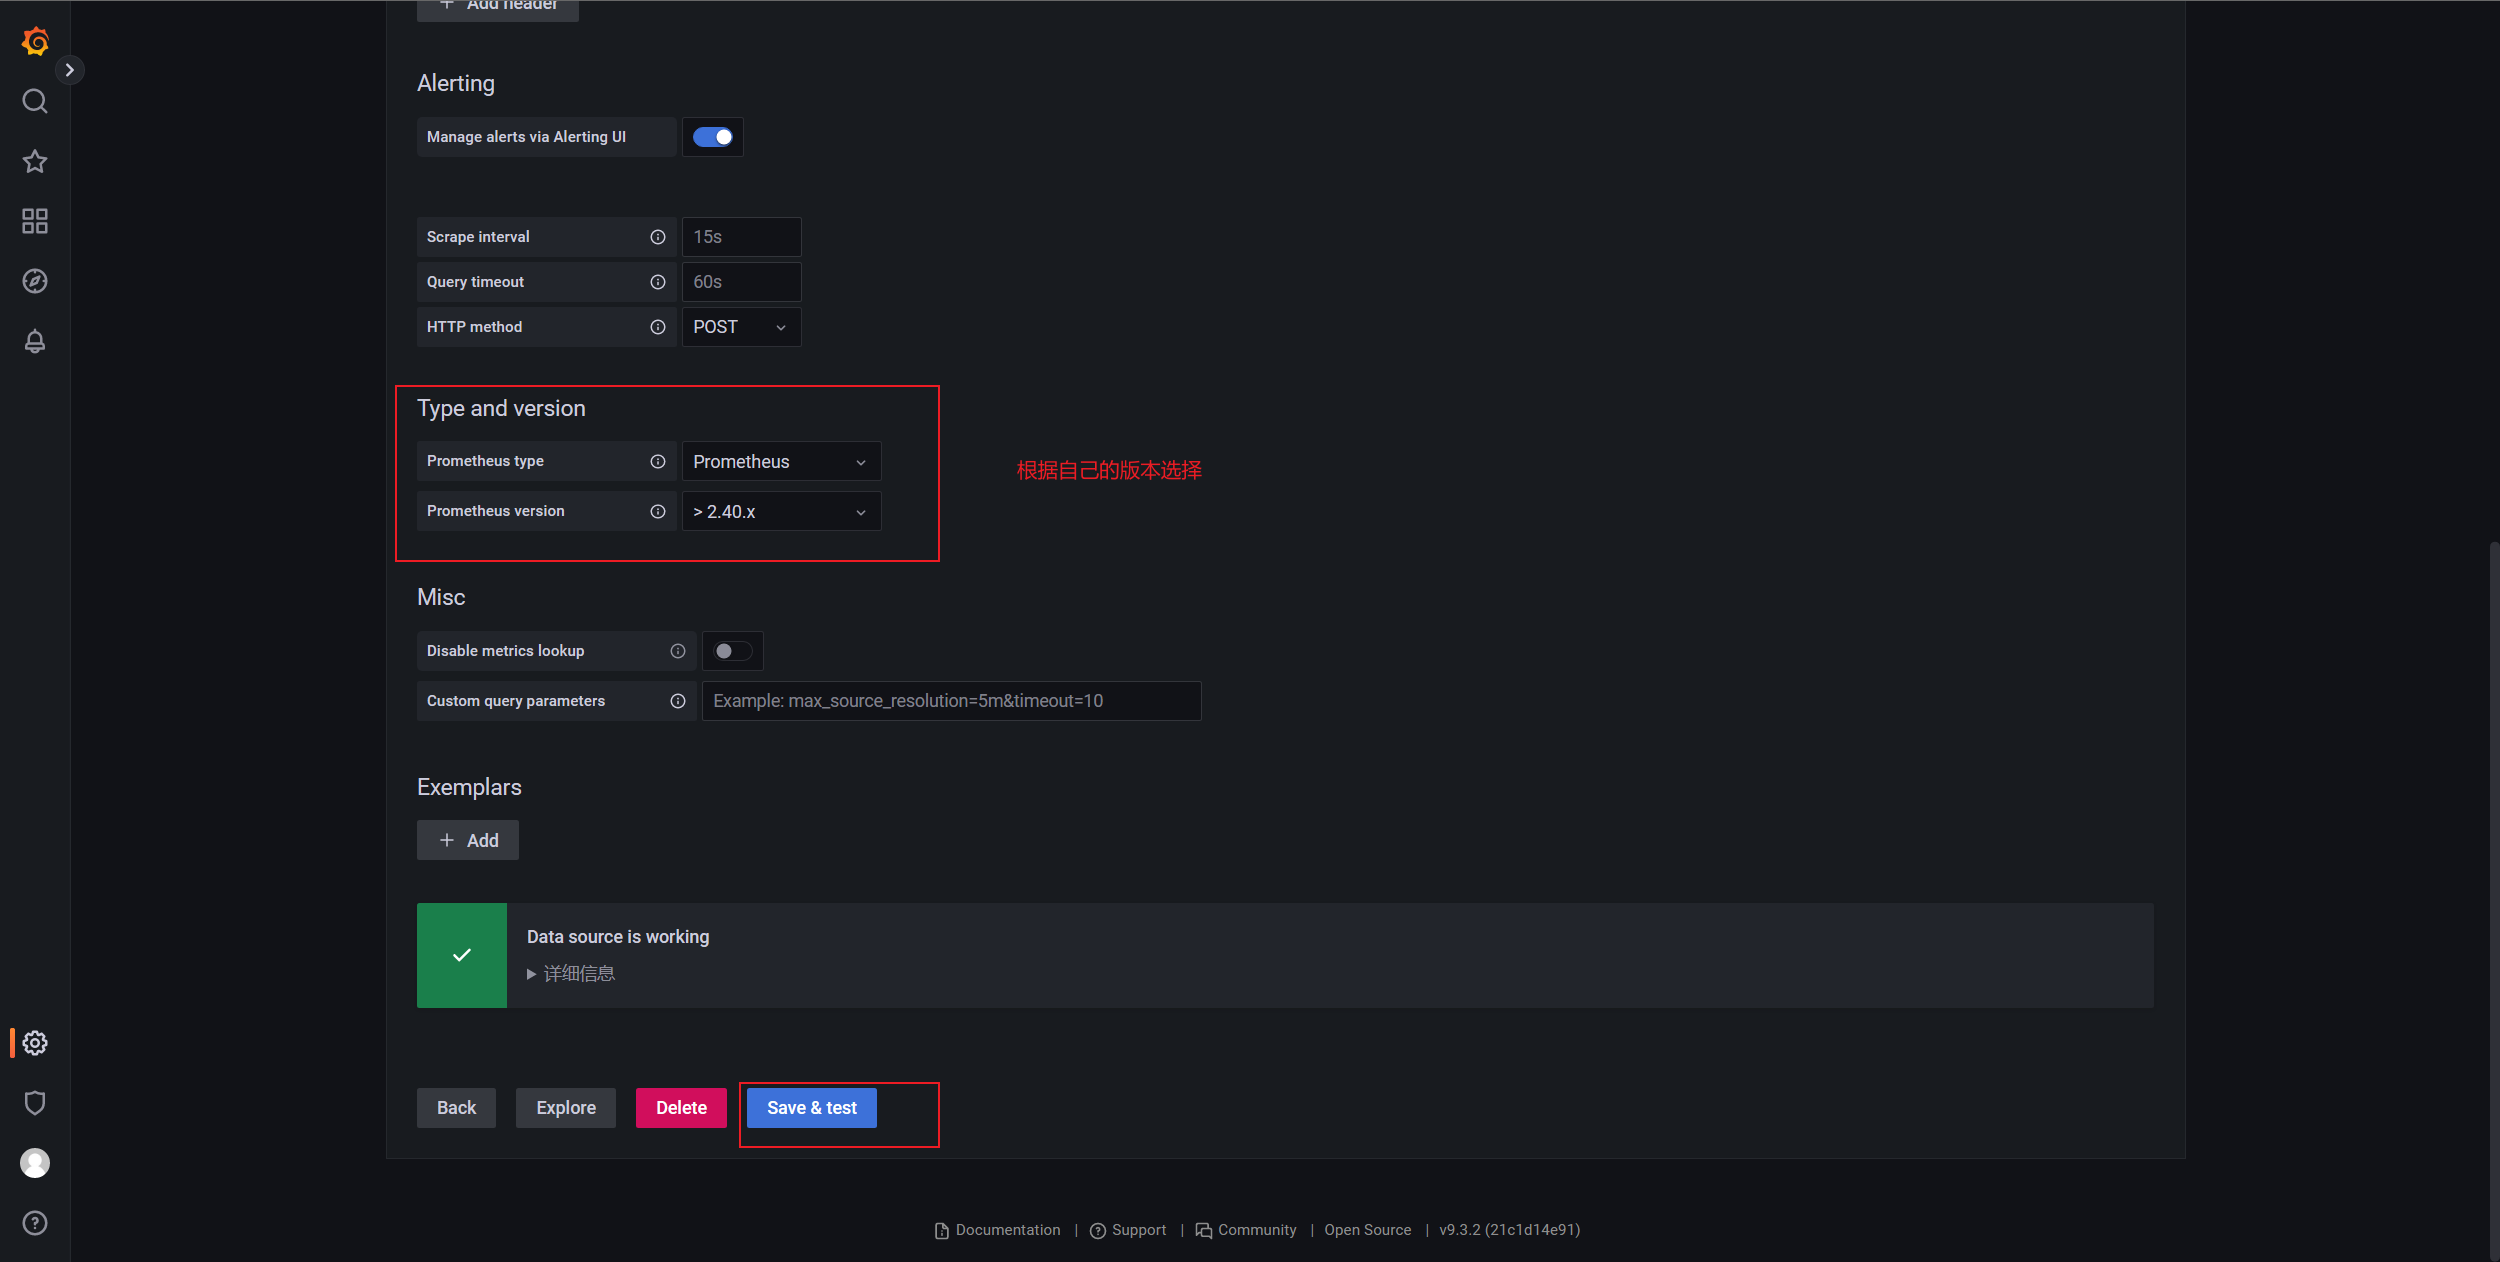
选择数据源
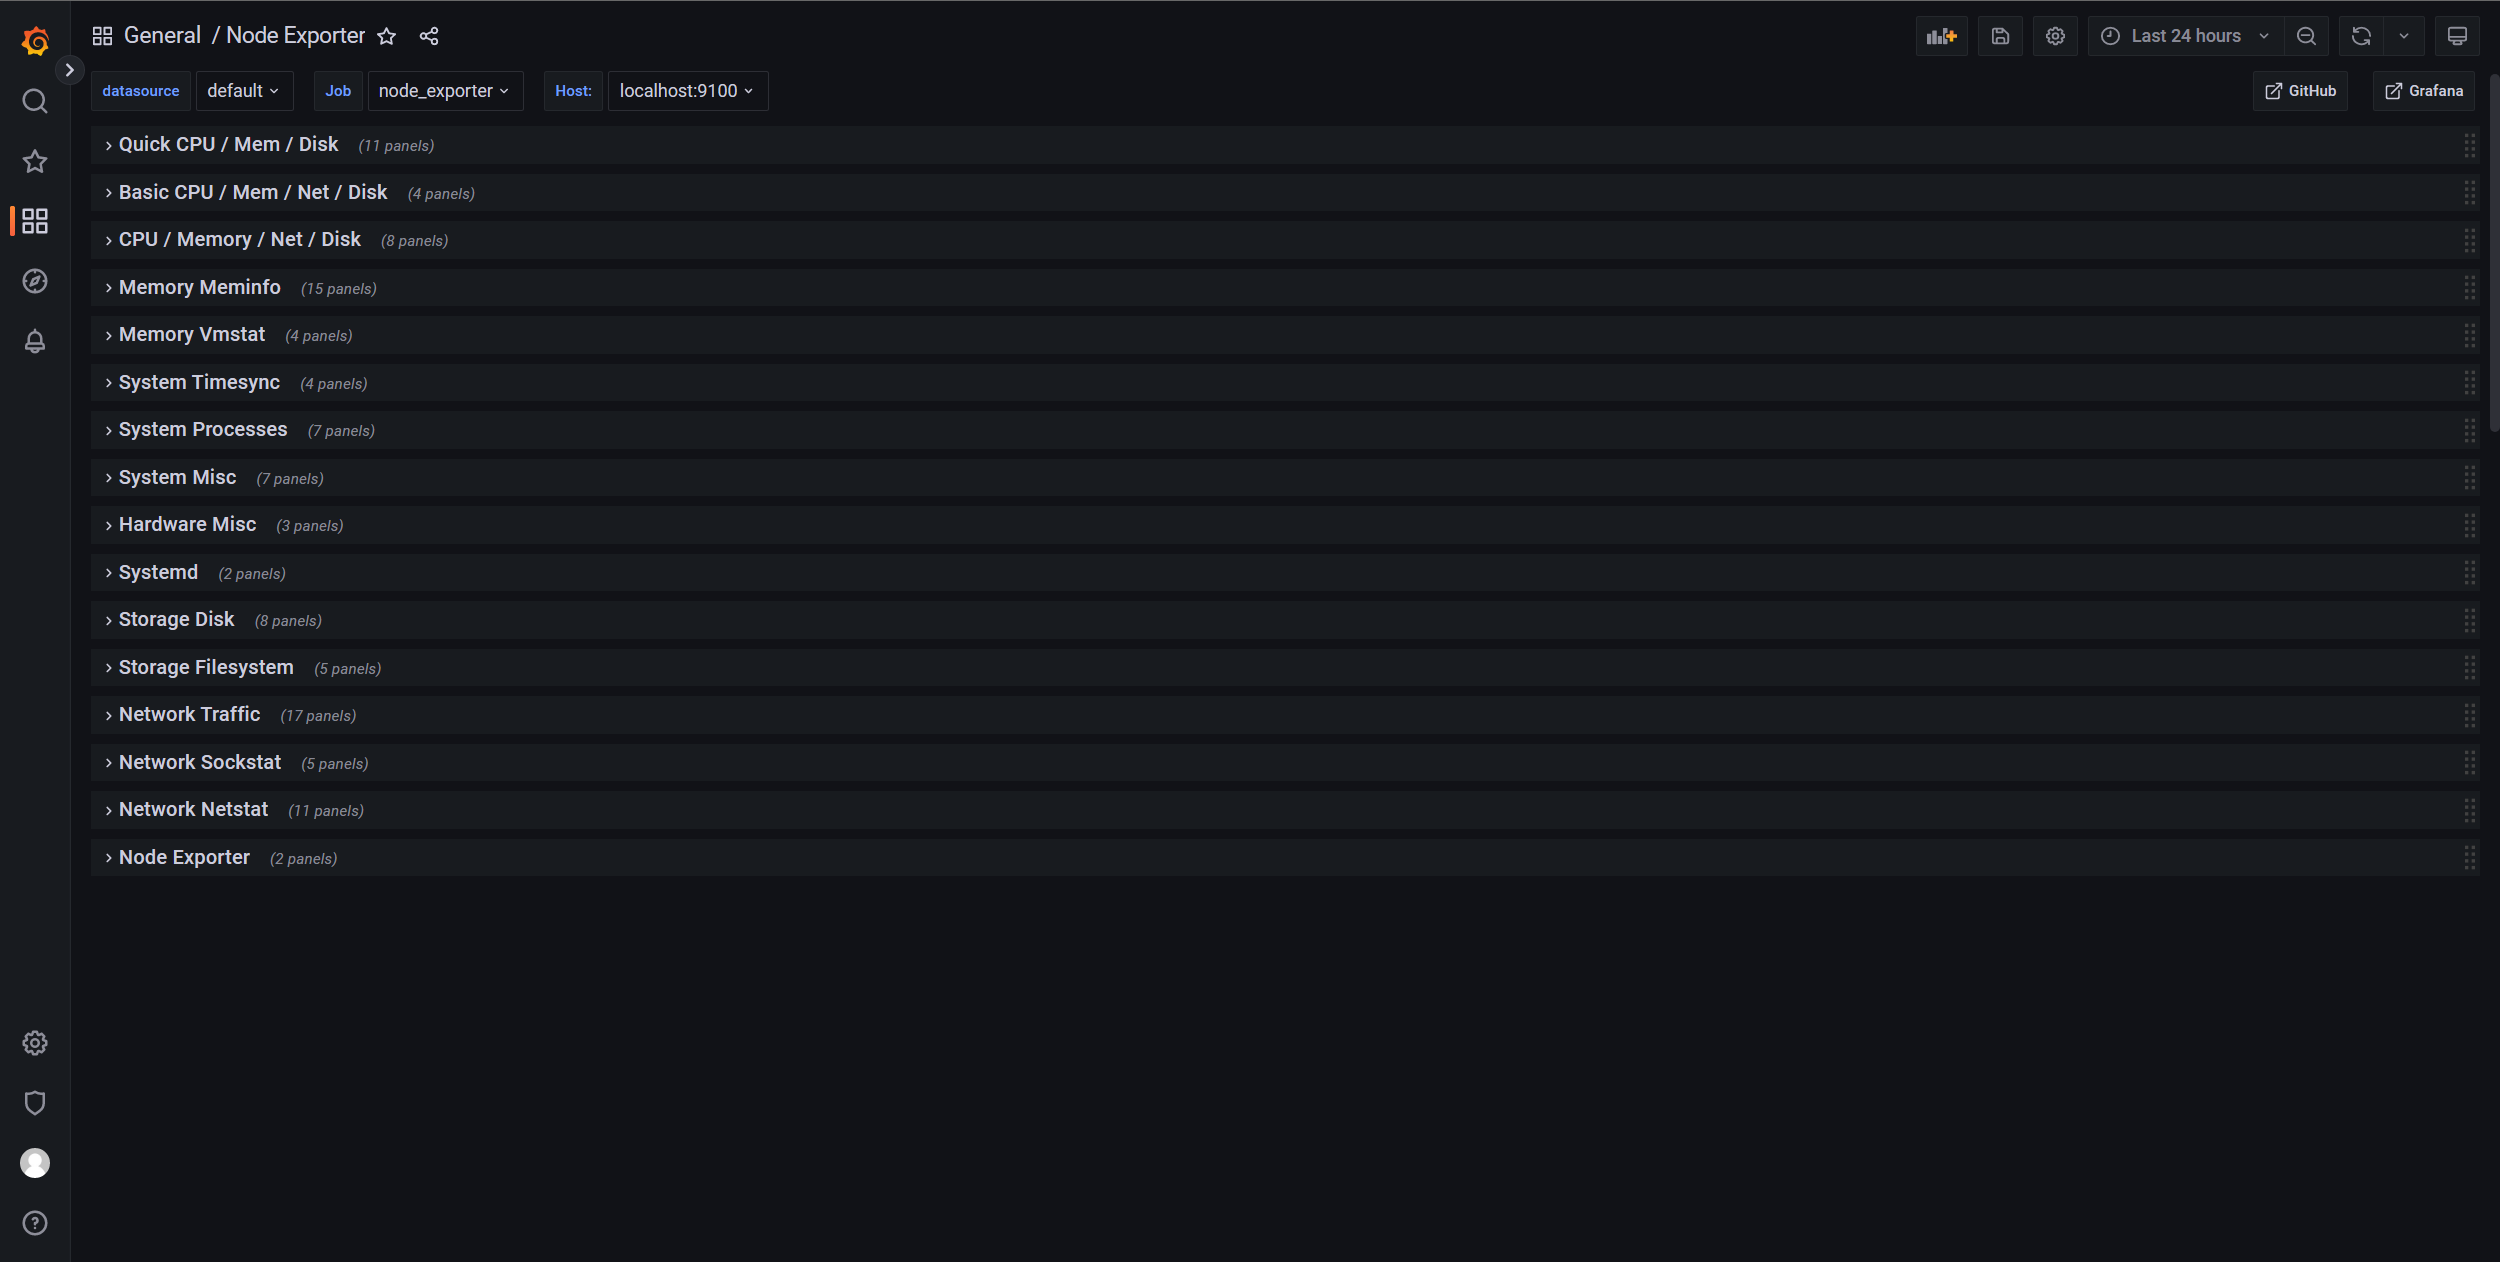
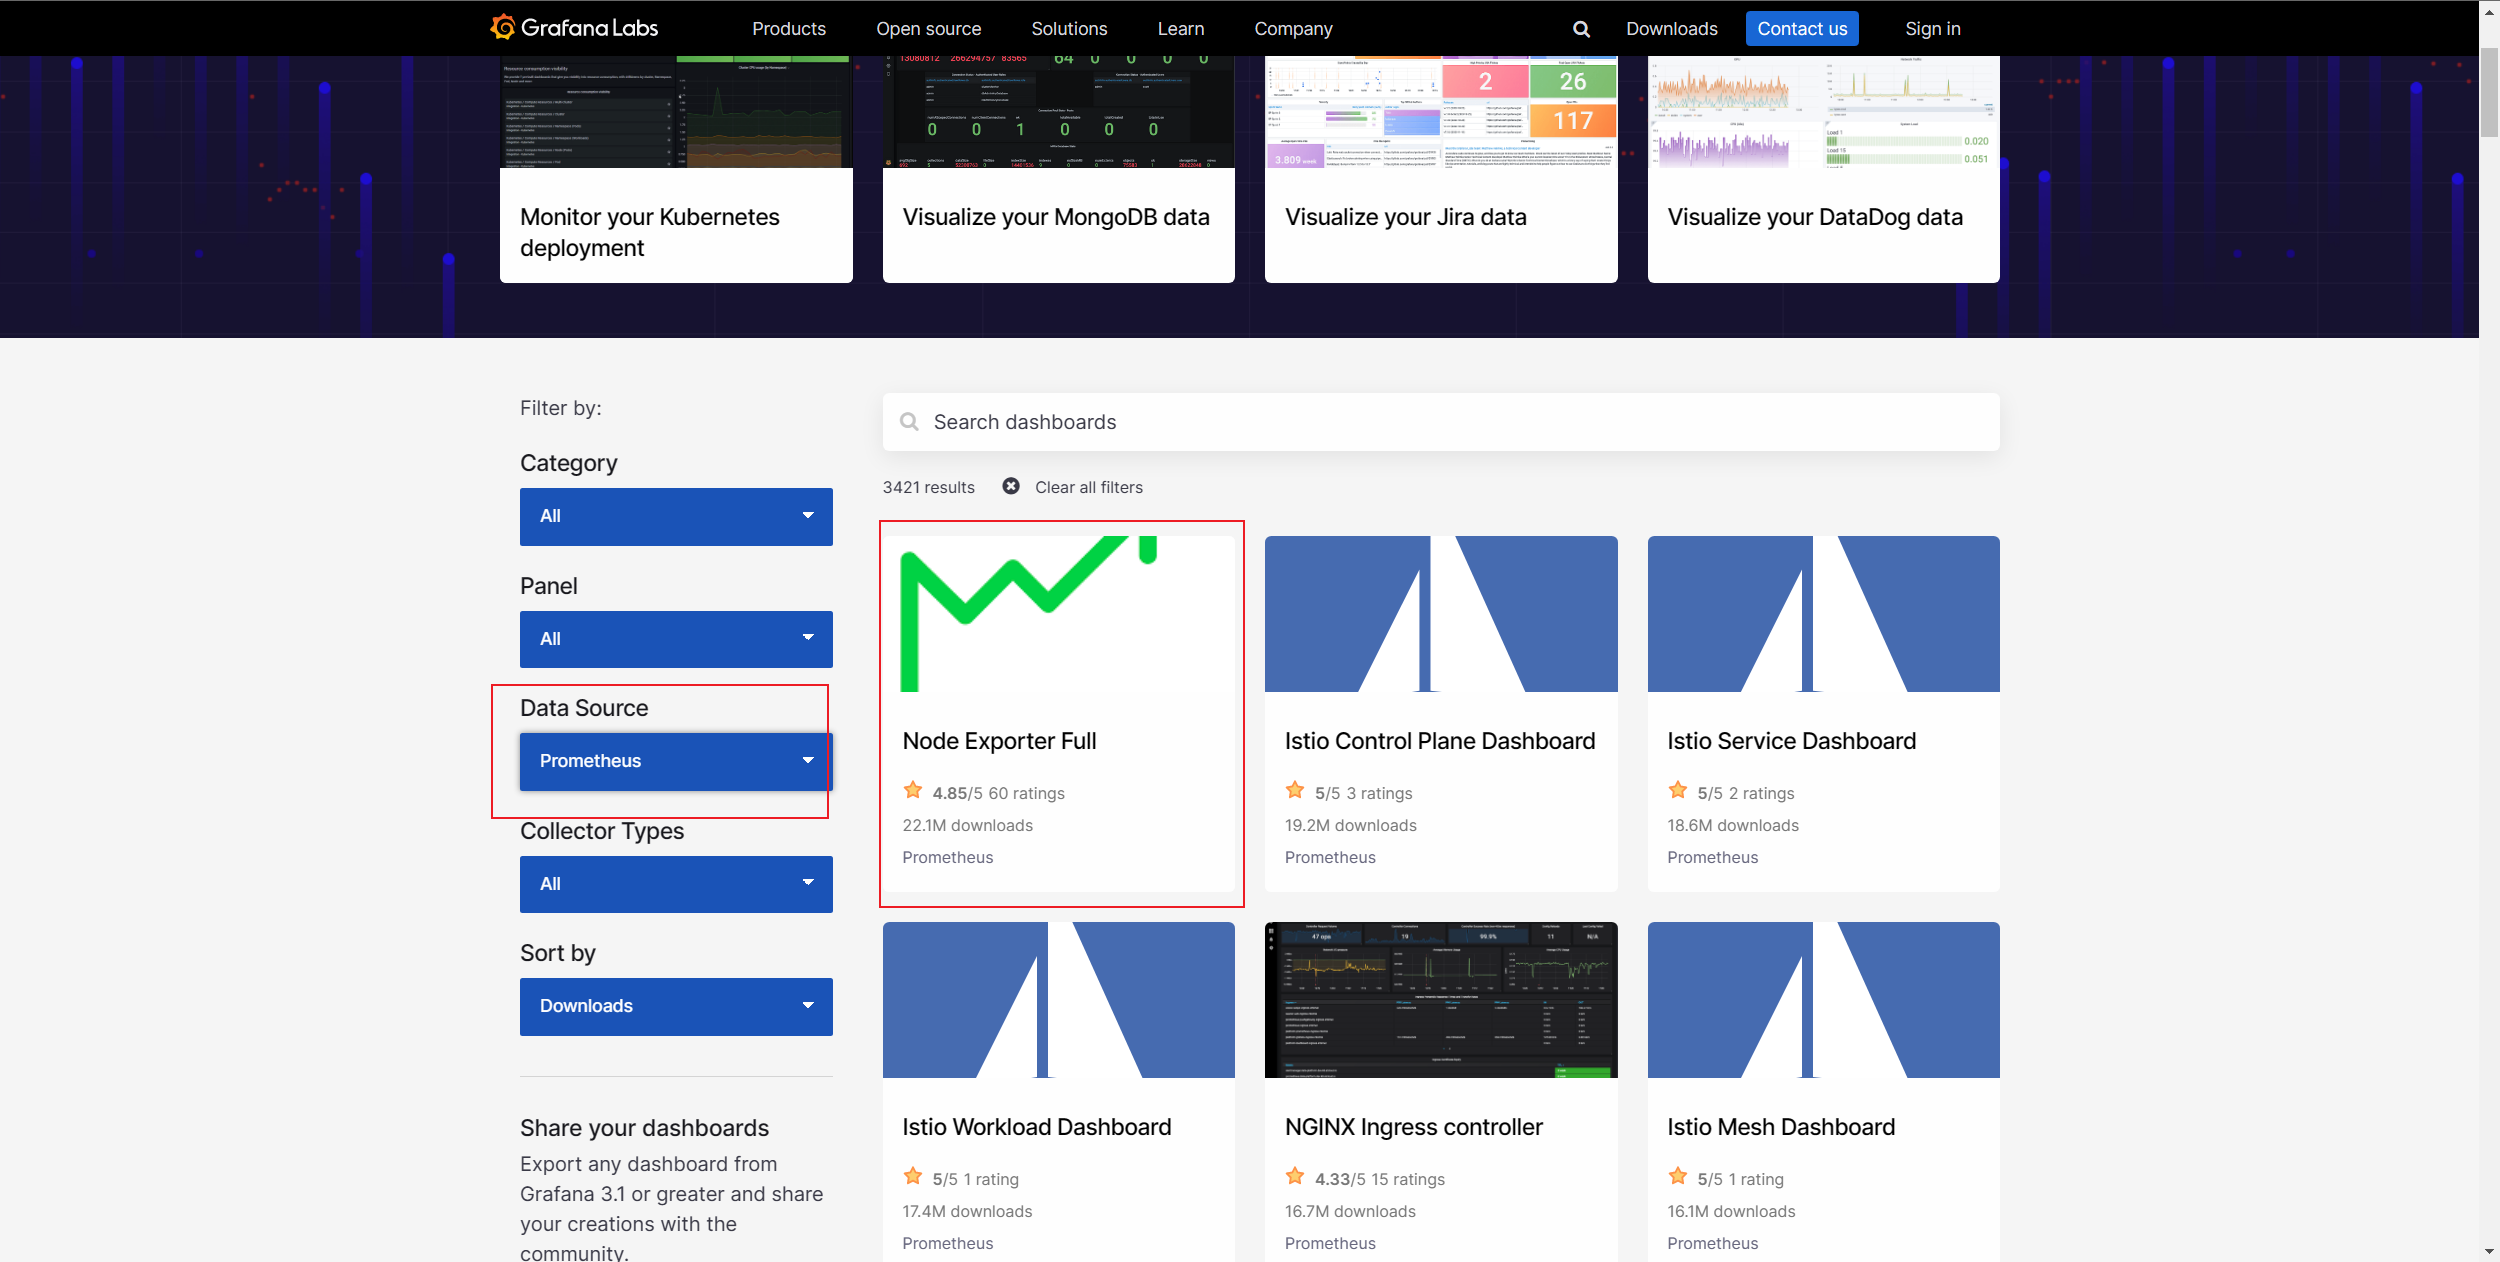
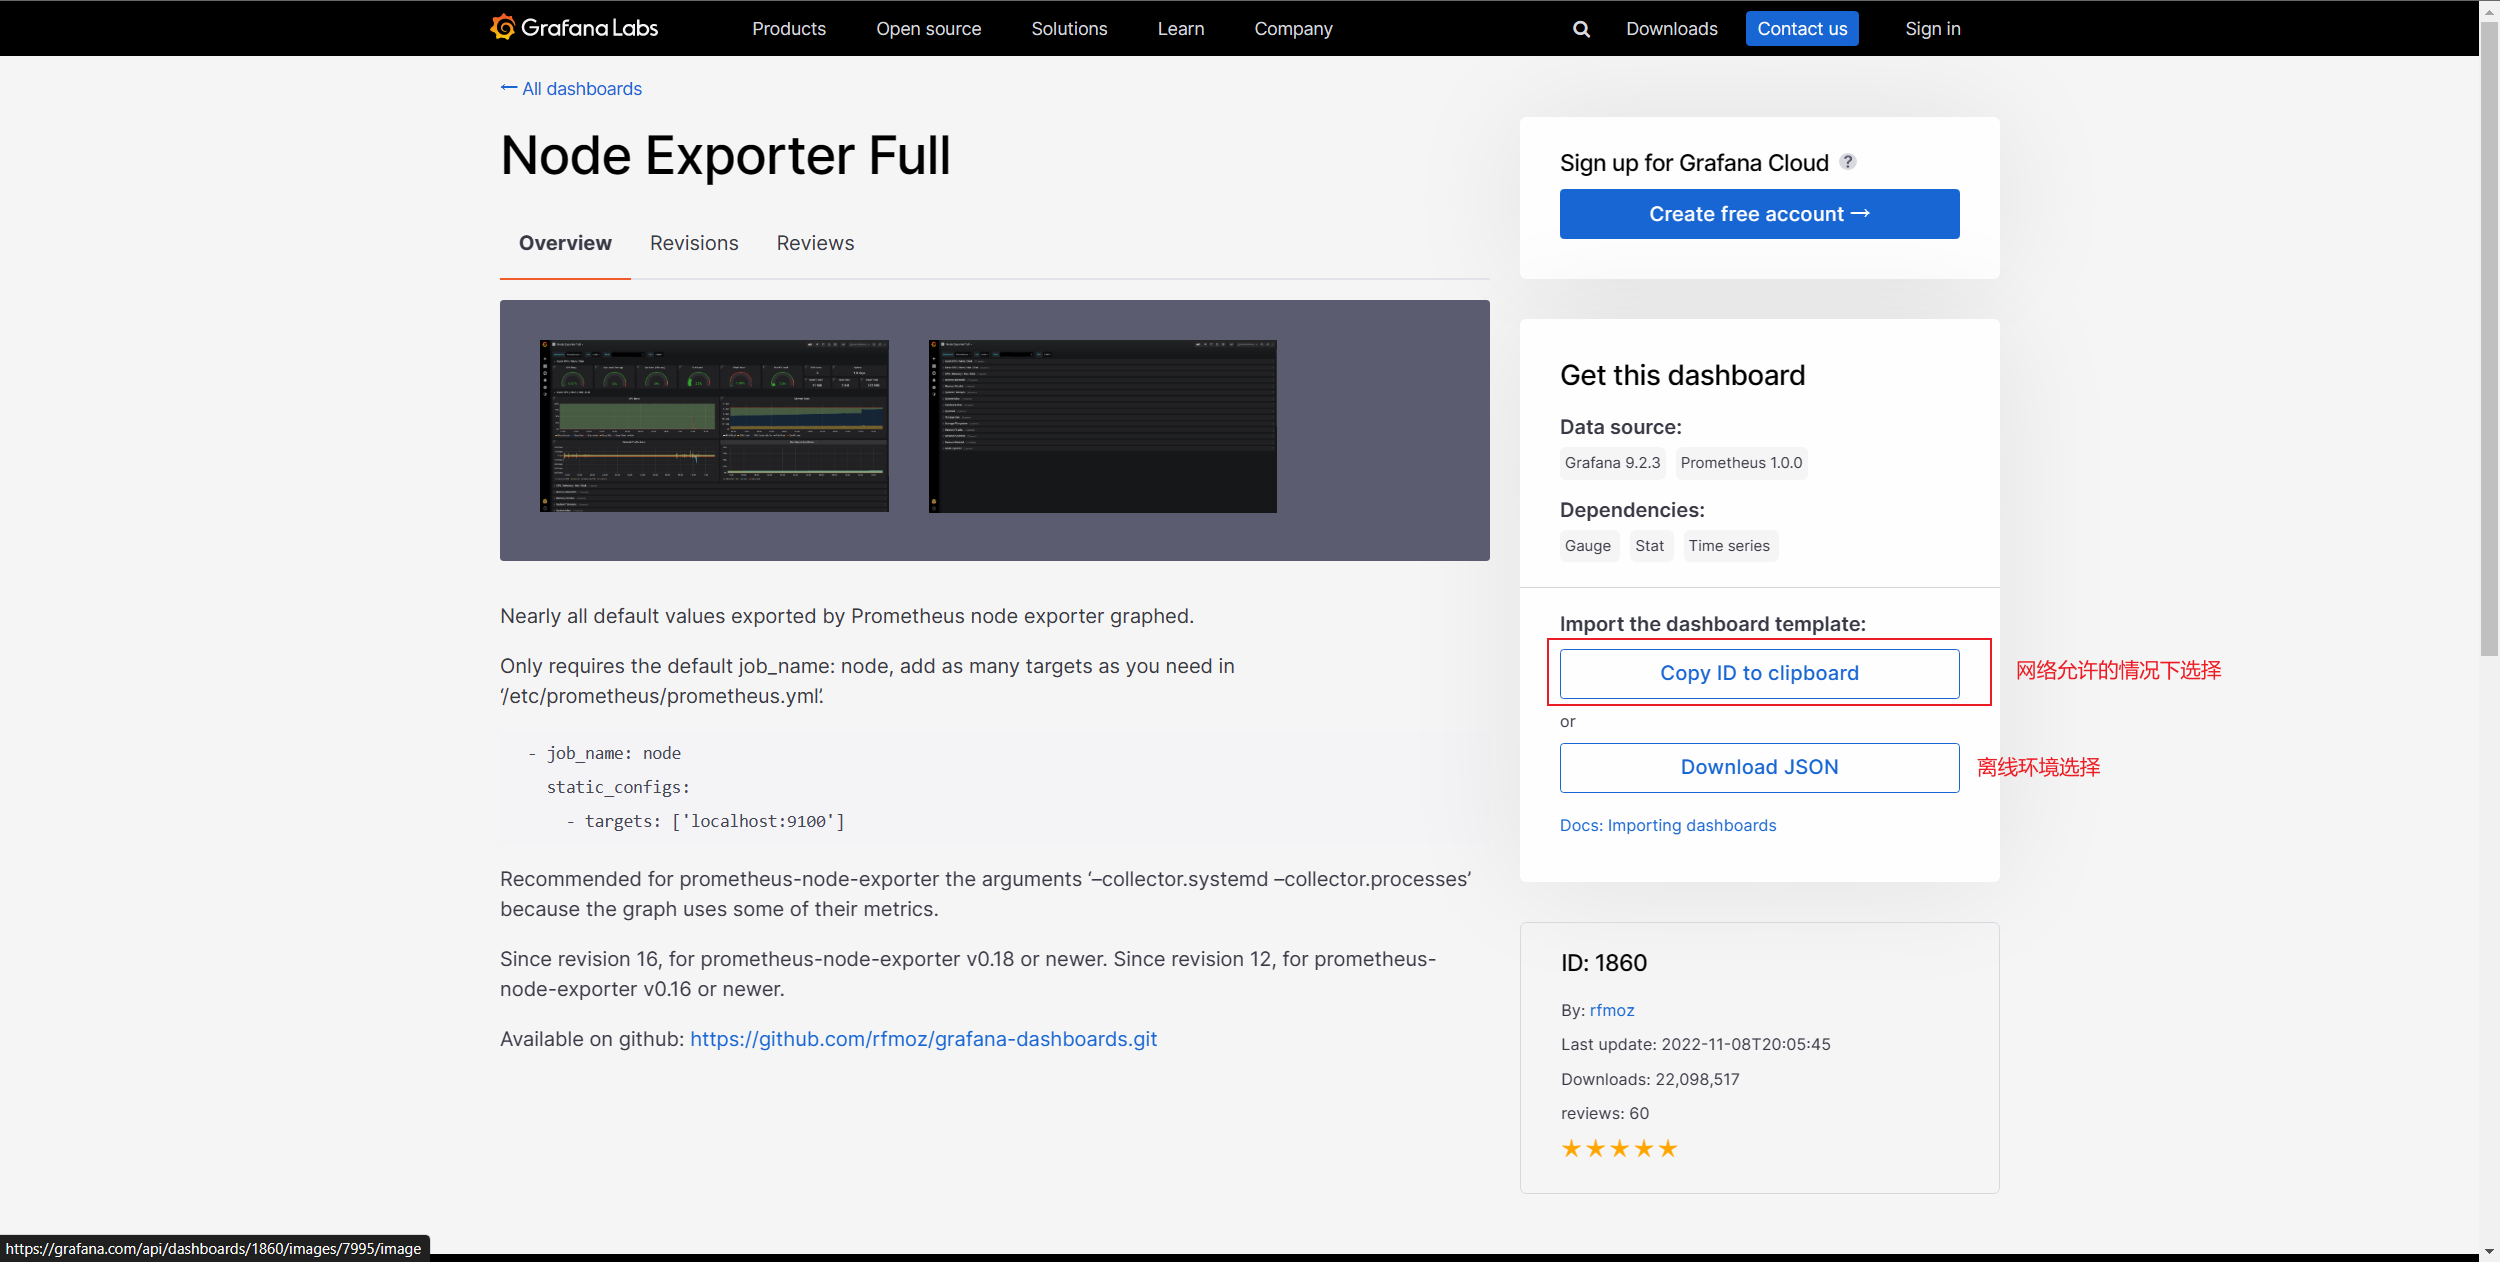
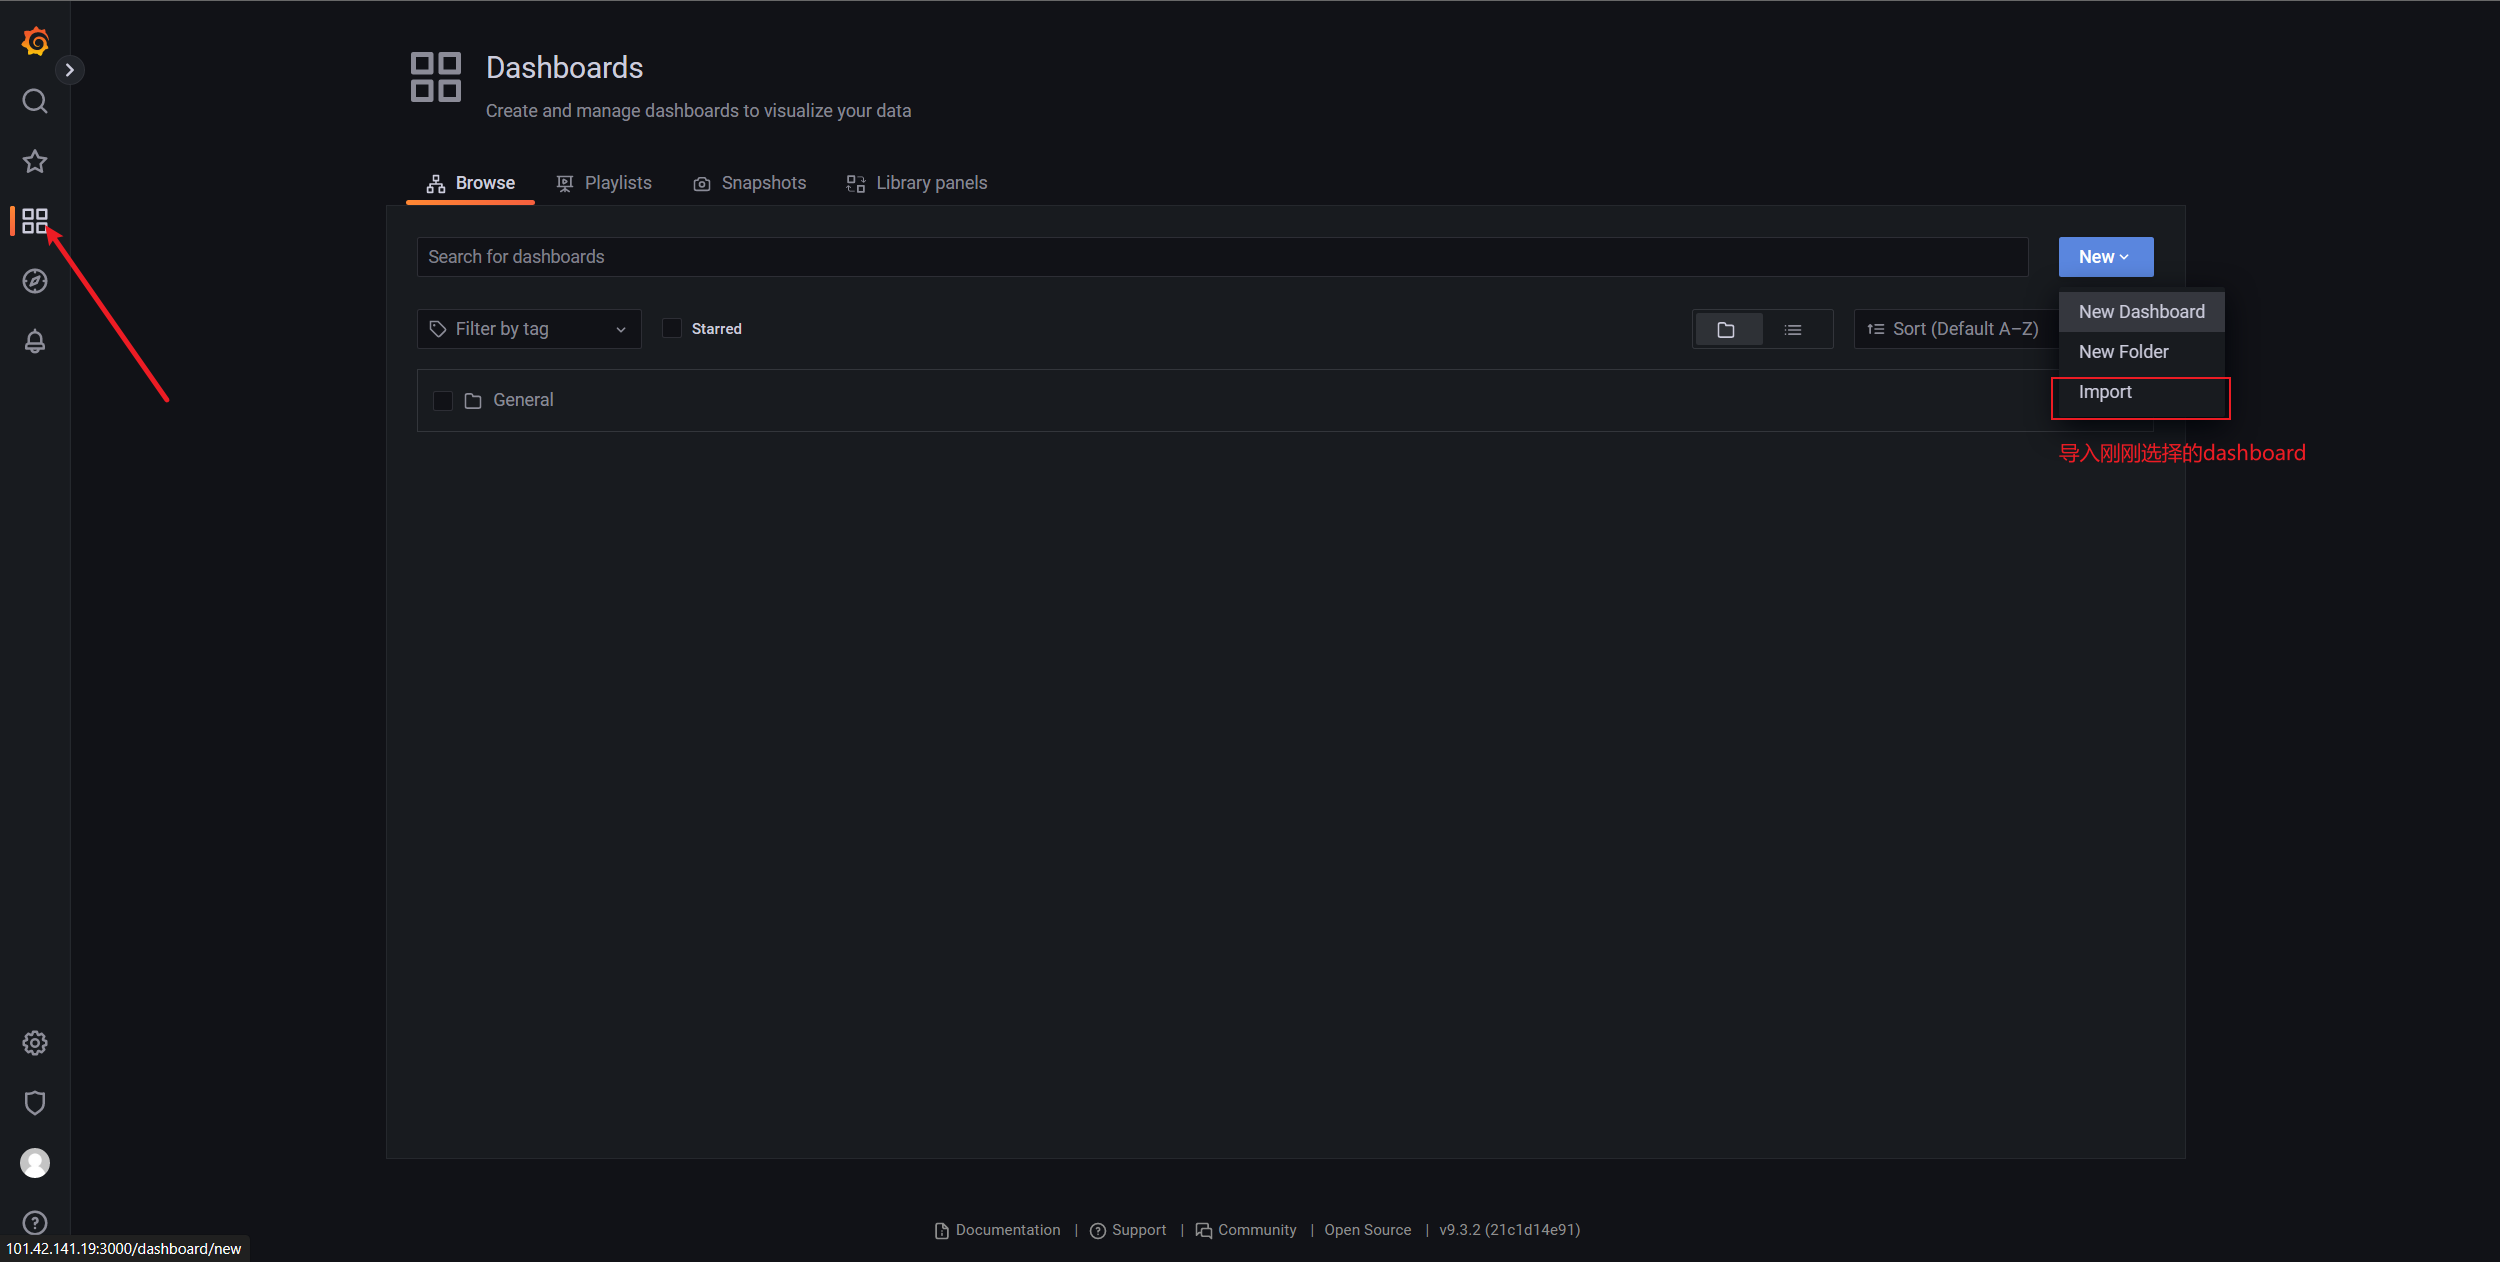
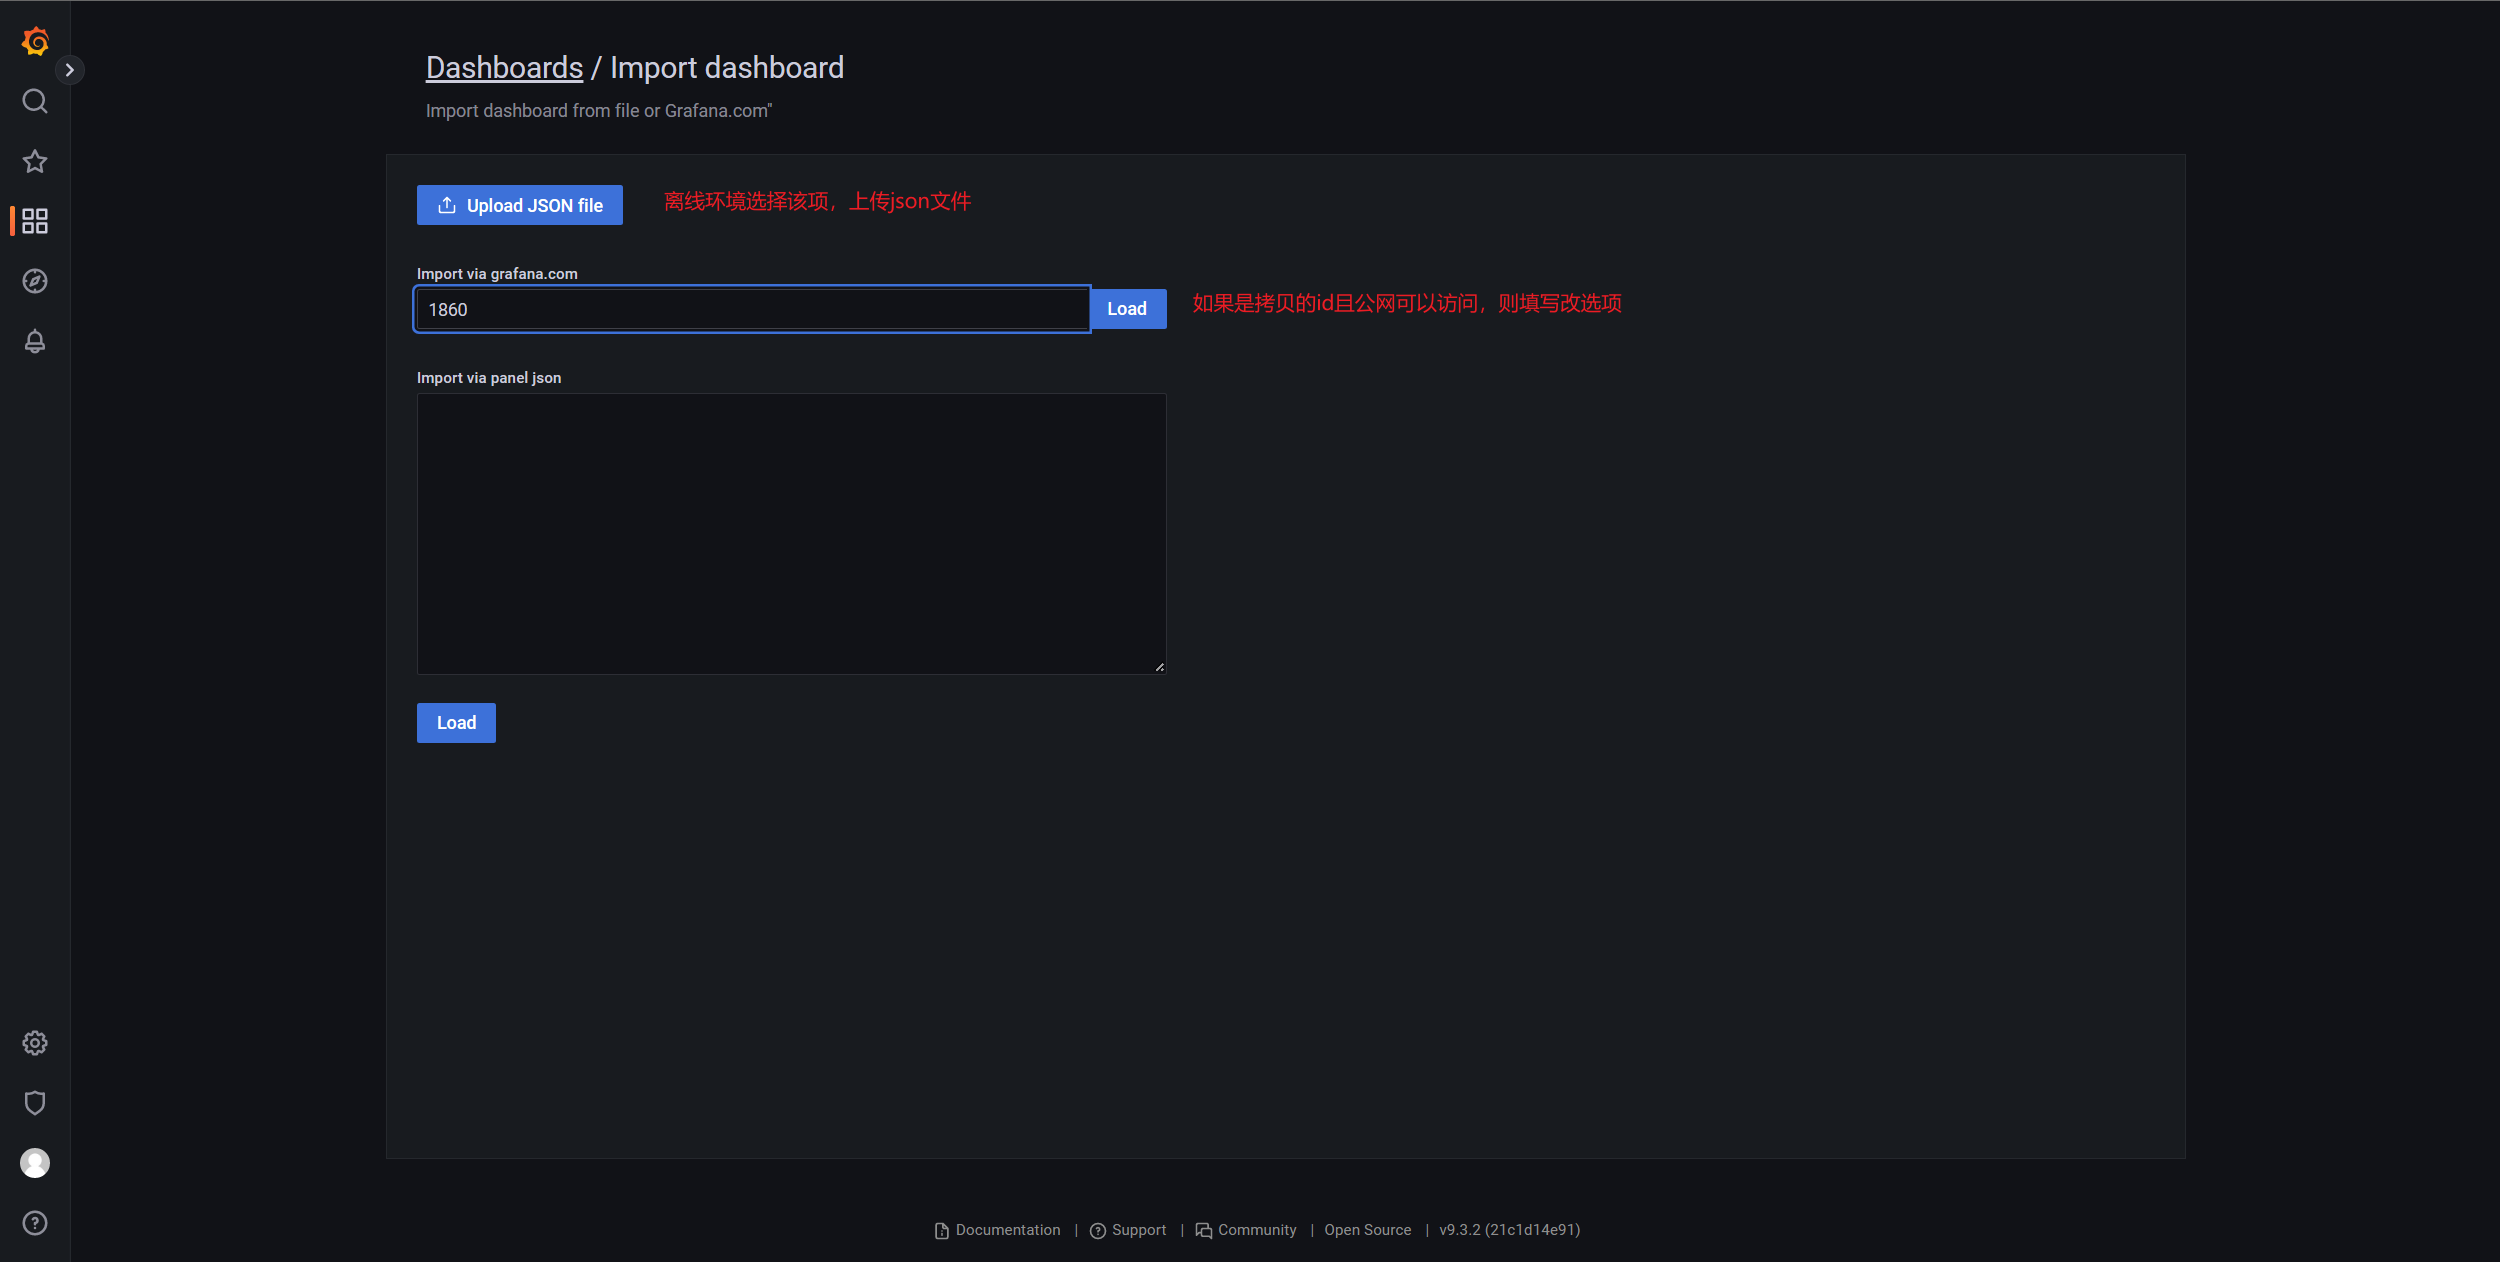
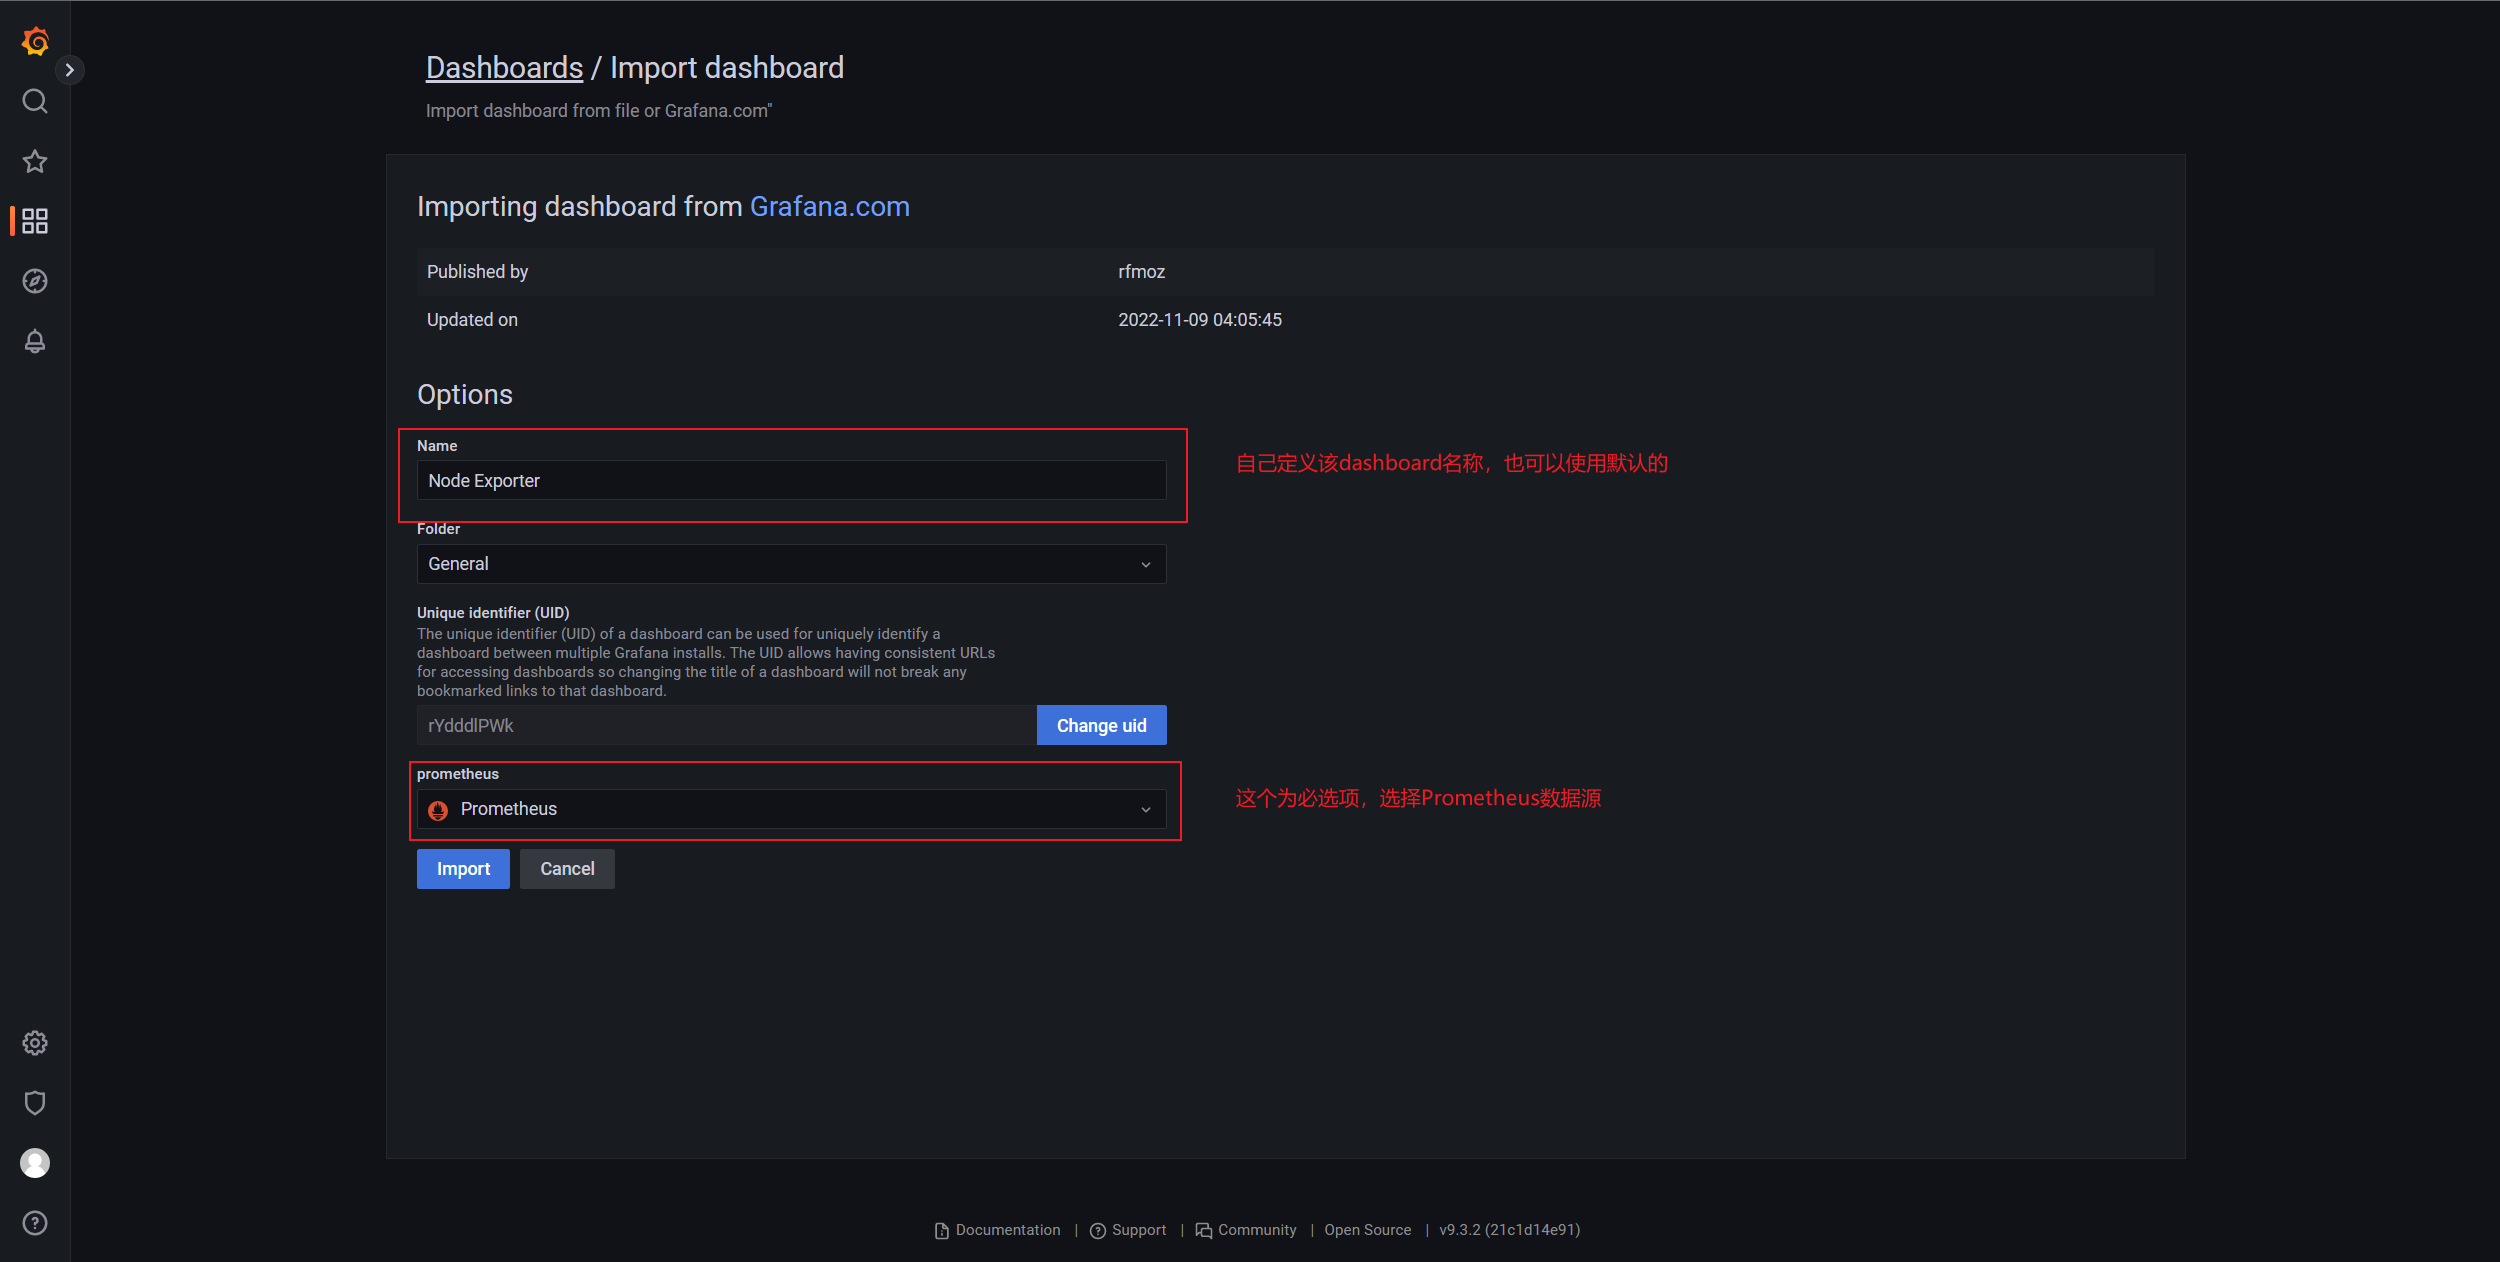
选择dashboard
我们可以根据数据源查询合适的dashboard仪表盘,这里我们选择第一个,如果没有自己喜欢的,可以自己在grafana里编写,小白还是直接用现成的轮子吧,嘻嘻
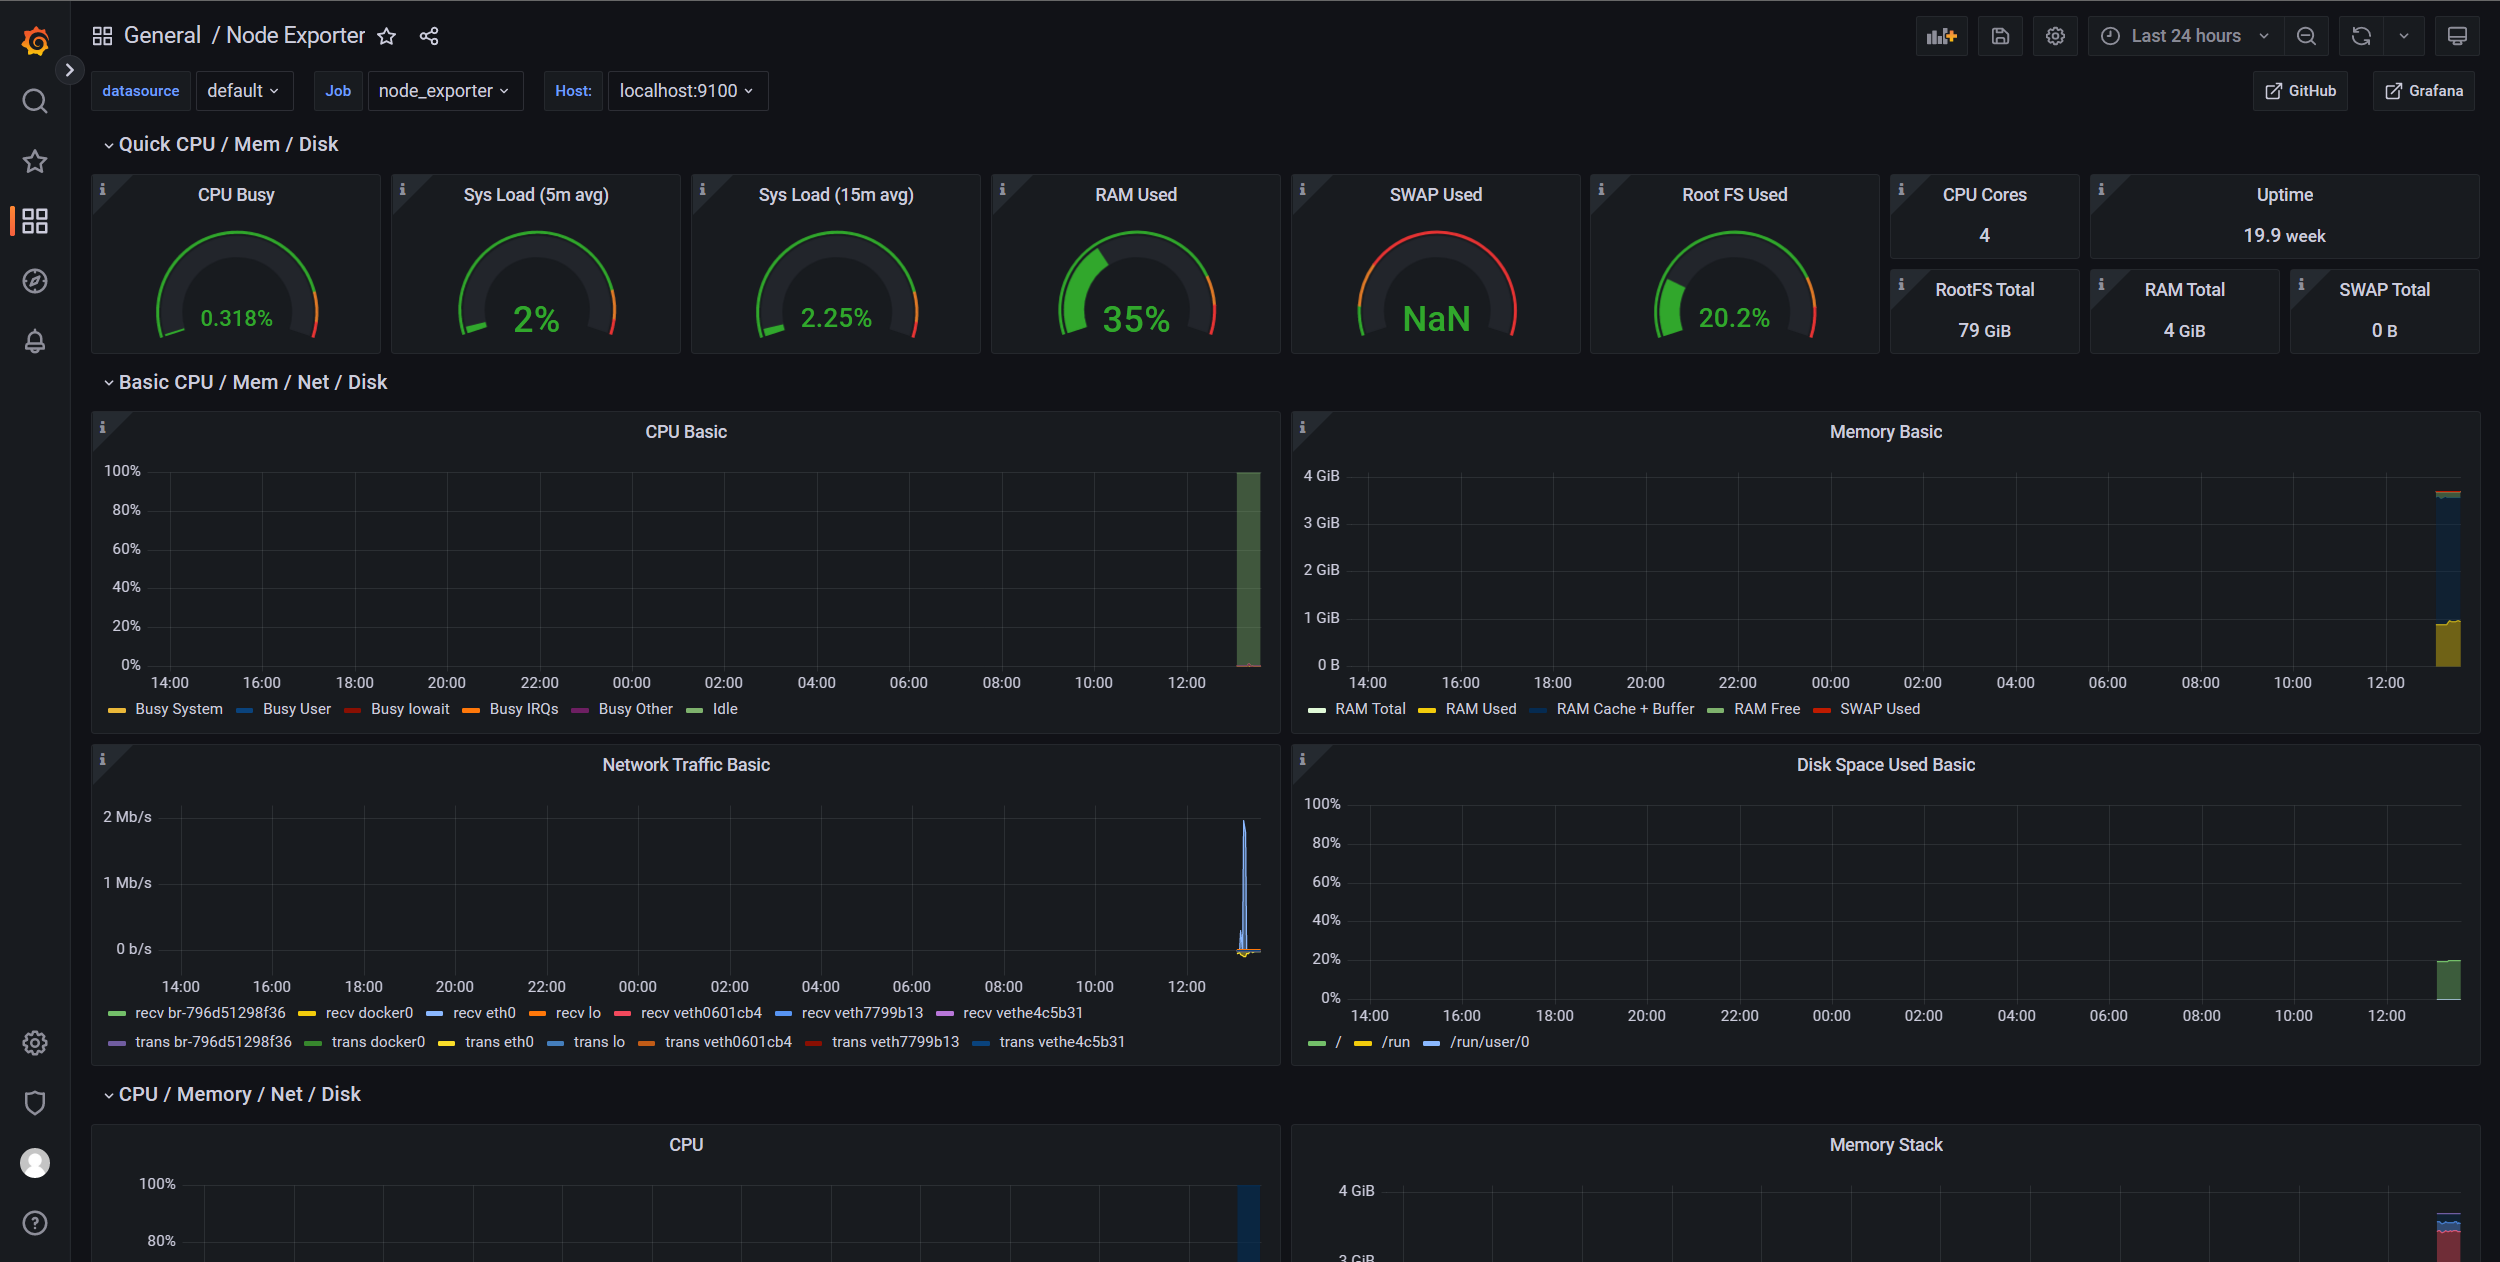
显示效果
dashboard包含了CPU,内存,网络,磁盘,io等信息