监控环境:Prometheus
数据库:MongoDB 3.4.6 集群,3个节点
监控工具:mongodb_exporter
1、创建Mongodb监控可读账号
mongodb admin 库中执行

use admin
db.createUser({
    user: "prometheus",
    pwd: "prometheus",
    roles: [
        { role: "read", db: "admin" },
        { role: "readAnyDatabase", db: "admin" },
        { role: "clusterMonitor", db: "admin" }
    ]
});
2、下载MongoDB监控软件
地址: https://github.com/percona/mongodb_exporter
我使用的:mongodb_exporter-0.11.2.linux-amd64.tar.gz 版本
3、配置文件
nohup ./mongodb_exporter --mongodb.uri mongodb://root:[email protected]:27017/admin --collect.database --collect.collection --collect.topmetrics --collect.indexusage --collect.connpoolstats --suppress.collectshardingstatus &mongodb_exporter暴露的endpoint端口默认为9216
[root@prometheus-server exporter]# ./mongodb_exporter --help
usage: mongodb_exporter [<flags>]

exports various MongoDB metrics in Prometheus format.

Flags:
  -h, --help                   Show context-sensitive help (also try --help-long and --help-man).
      --web.auth-file=WEB.AUTH-FILE
                               Path to YAML file with server_user, server_password keys for HTTP Basic authentication (overrides HTTP_AUTH environment variable).
      --web.ssl-cert-file=WEB.SSL-CERT-FILE
                               Path to SSL certificate file.
      --web.ssl-key-file=WEB.SSL-KEY-FILE
                               Path to SSL key file.
      --web.listen-address=":9216"
                               Address to listen on for web interface and telemetry.
      --web.telemetry-path="/metrics"
                               Path under which to expose metrics.
      --collect.database       Enable collection of Database metrics
      --collect.collection     Enable collection of Collection metrics
      --collect.topmetrics     Enable collection of table top metrics
      --collect.indexusage     Enable collection of per index usage stats
      --collect.connpoolstats  Collect MongoDB connpoolstats
      --suppress.collectshardingstatus
                               Suppress the collection of Sharding Status
      --mongodb.uri=[mongodb://][user:pass@]host1[:port1][,host2[:port2],...][/database][?options]
                               MongoDB URI, format
      --test                   Check MongoDB connection, print buildInfo() information and exit.
      --version                Show application version.
      --log.level="info"       Only log messages with the given severity or above. Valid levels: [debug, info, warn, error, fatal]
      --log.format="logger:stderr"
                               Set the log target and format. Example: "logger:syslog?appname=bob&local=7" or "logger:stdout?json=true"
配置启动服务
vim /usr/lib/systemd/system/mongodb_exporter.service
[Unit]
Description=mongodb_exporter
Documentation=https://github.com/percona/mongodb_exporter
After=network.target

[Service]
Type=simple
User=prometheus
Environment="MONGODB_URI=mongodb://mongodb_exporter:123456@localhost:27017"
ExecStart=/usr/local/bin/mongodb_exporter --log.level=error \
  --collect.database \
  --collect.collection \
  --collect.topmetrics \
  --collect.indexusage \
  --collect.connpoolstats

Restart=on-failure

[Install]
WantedBy=multi-user.target
4、prometheus配置基于文件的自动发现
- job_name: 'mongo_cluster'
file_sd_configs:
- files: ['/usr/local/prometheus/sd_config/mongo_cluster.yaml']
refresh_interval: 5s
root:/usr/local/prometheus# cat /usr/local/prometheus/sd_config/mongo_cluster.yaml
- targets:
- "192.168.88.140:9216"
- "192.168.88.141:9216"
- "192.168.88.142:9216"
labels:
project: mongo
unitname: "Mongodb_exporter"
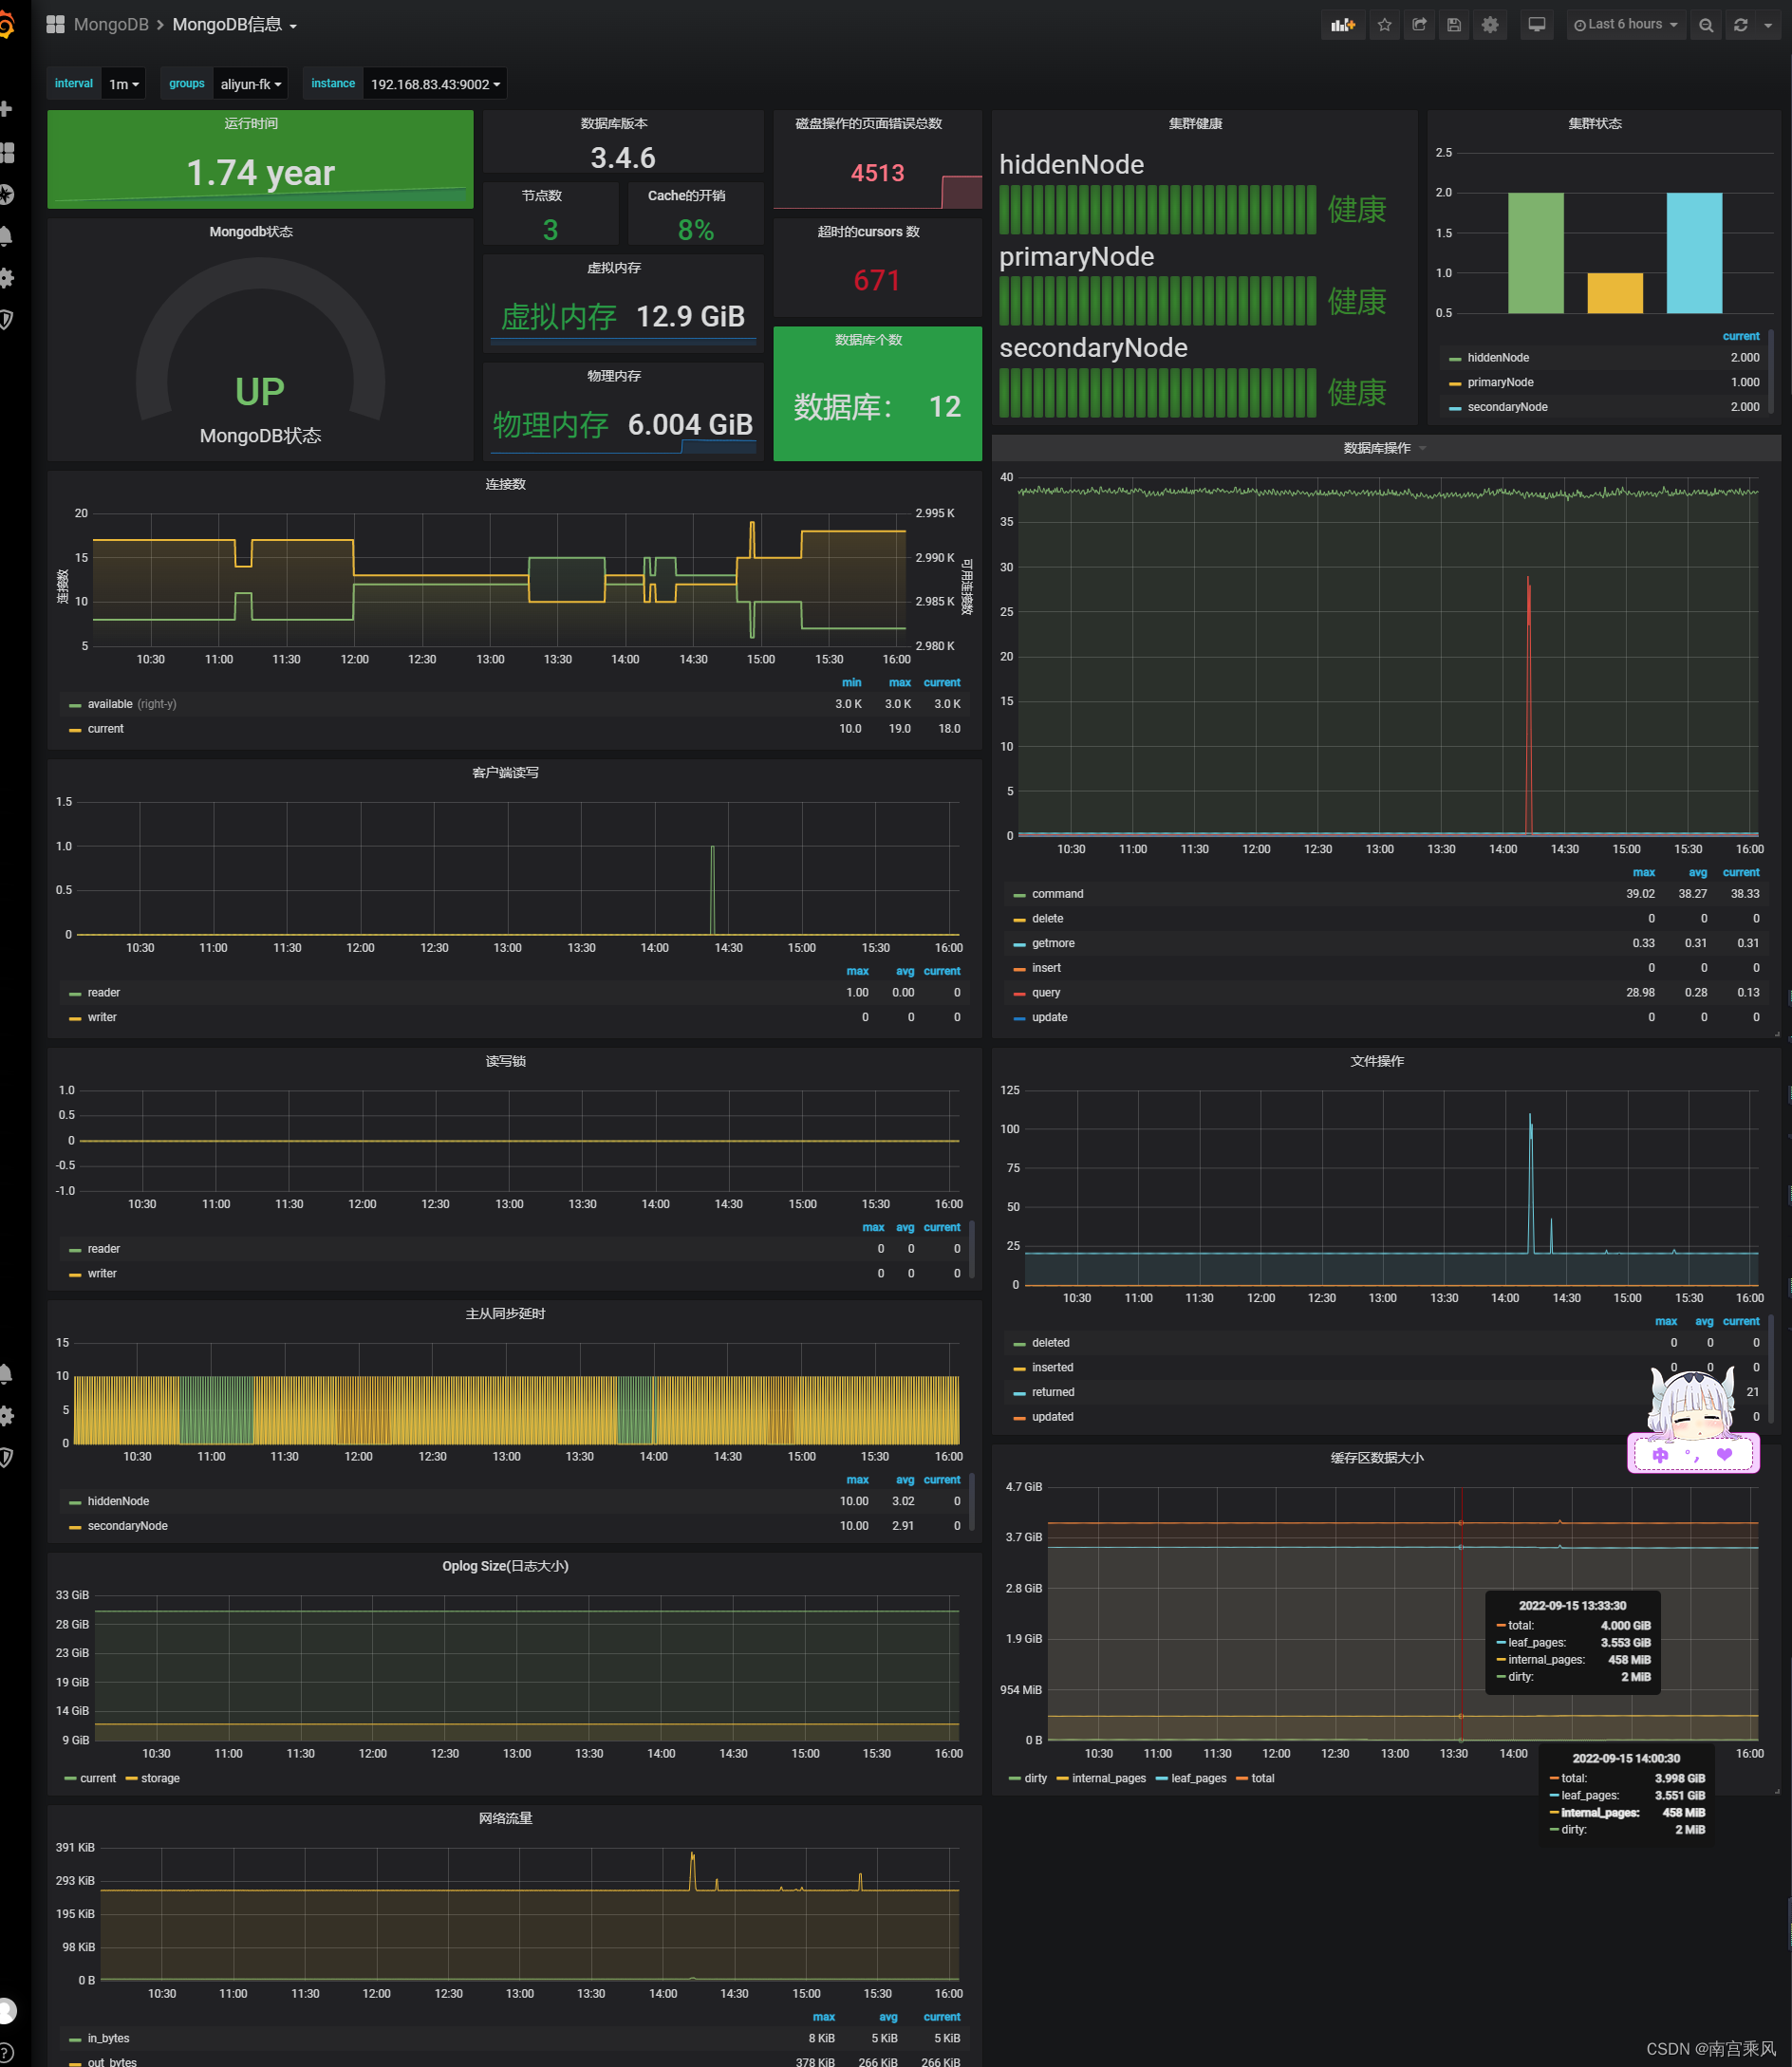
service: mongo5、grafana配置mongo展示图
导入图:16974
MongoDB信息 | Grafana Labs (这个模板是自己绘制的,有基础的可以二次开发)
__EOF__

- 本文作者: 南宫乘风
- 本文链接: https://www.cnblogs.com/heian99/p/16712479.html
- 关于博主: 评论和私信会在第一时间回复。或者直接私信我。
- 版权声明: 本博客所有文章除特别声明外,均采用 BY-NC-SA 许可协议。转载请注明出处!
- 声援博主: 如果您觉得文章对您有帮助,可以点击文章右下角【推荐】一下。
 南宫乘风
南宫乘风粉丝 - 76 关注 - 6 +加关注 0 0 « 上一篇: Jenkins集成Kubernetes集群
» 下一篇: Prometheus监控进程 标签:exporter,--,MongoDB,数据库,prometheus,collect,Prometheus,mongodb From: https://www.cnblogs.com/gaoyanbing/p/18168546