import numpy as np
from sklearn import cluster
from osgeo import gdal, gdal_array
import matplotlib.pyplot as plt

gdal.UseExceptions()
gdal.AllRegister()
img_ds = gdal.Open('./raster/LC8_2020.tif', gdal.GA_ReadOnly)

band = img_ds.GetRasterBand(2)

img = band.ReadAsArray()
img_ds.RasterXSize
942
X = img.reshape((-1,1))
k_means = cluster.KMeans(n_clusters=8)
k_means.fit(X)

X_cluster = k_means.labels_
X_cluster = X_cluster.reshape(img.shape)
X_cluster.shape
(920, 942)
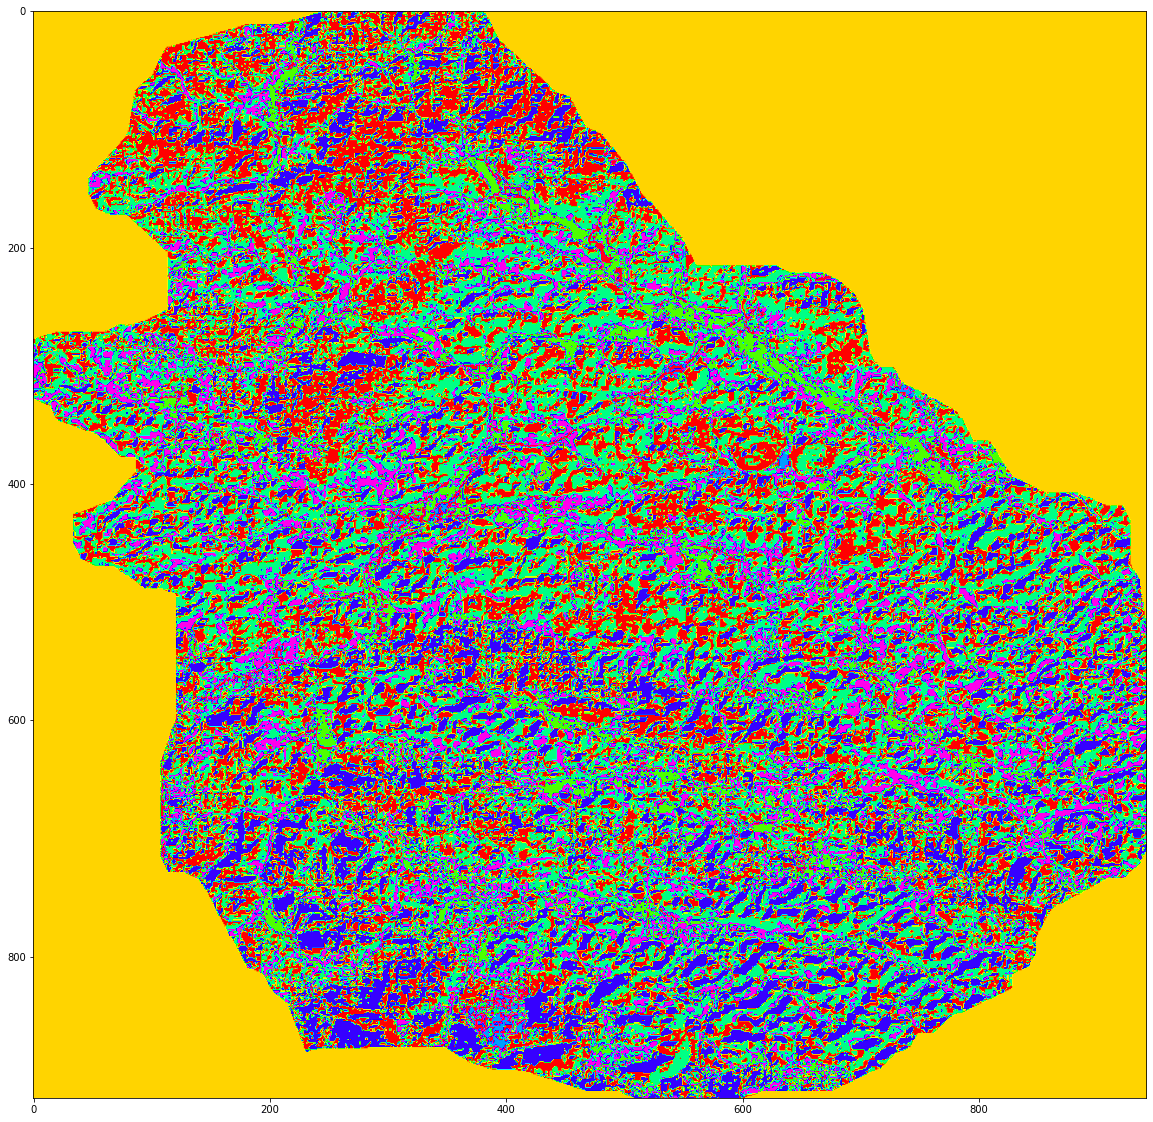
plt.figure(figsize=(20,20))
plt.imshow(X_cluster, cmap="hsv")
plt.show()

加入多个波段
img_ds = gdal.Open('./raster/LC8_2020.tif', gdal.GA_ReadOnly)
driver = gdal.GetDriverByName("GTiff")

img = np.zeros((img_ds.RasterYSize, img_ds.RasterXSize, img_ds.RasterCount),
               gdal_array.GDALTypeCodeToNumericTypeCode(img_ds.GetRasterBand(1).DataType))
[cols, rows] = img[:, :, 0].shape
trans = img_ds.GetGeoTransform()
proj = img_ds.GetProjection()

for b in range(img.shape[2]):
    img[:, :, b] = img_ds.GetRasterBand(b + 1).ReadAsArray()
new_shape = (img.shape[0] * img.shape[1], img.shape[2])
X = img[:, :, :3].reshape(new_shape)
(104.769919,
 0.0002827044278131621,
 0.0,
 24.076882,
 0.0,
 -0.0002827880434782616)
k_means = cluster.KMeans(n_clusters=8)
k_means.fit(X)

X_cluster = k_means.labels_
X_cluster = X_cluster.reshape(img[:, :, 0].shape)
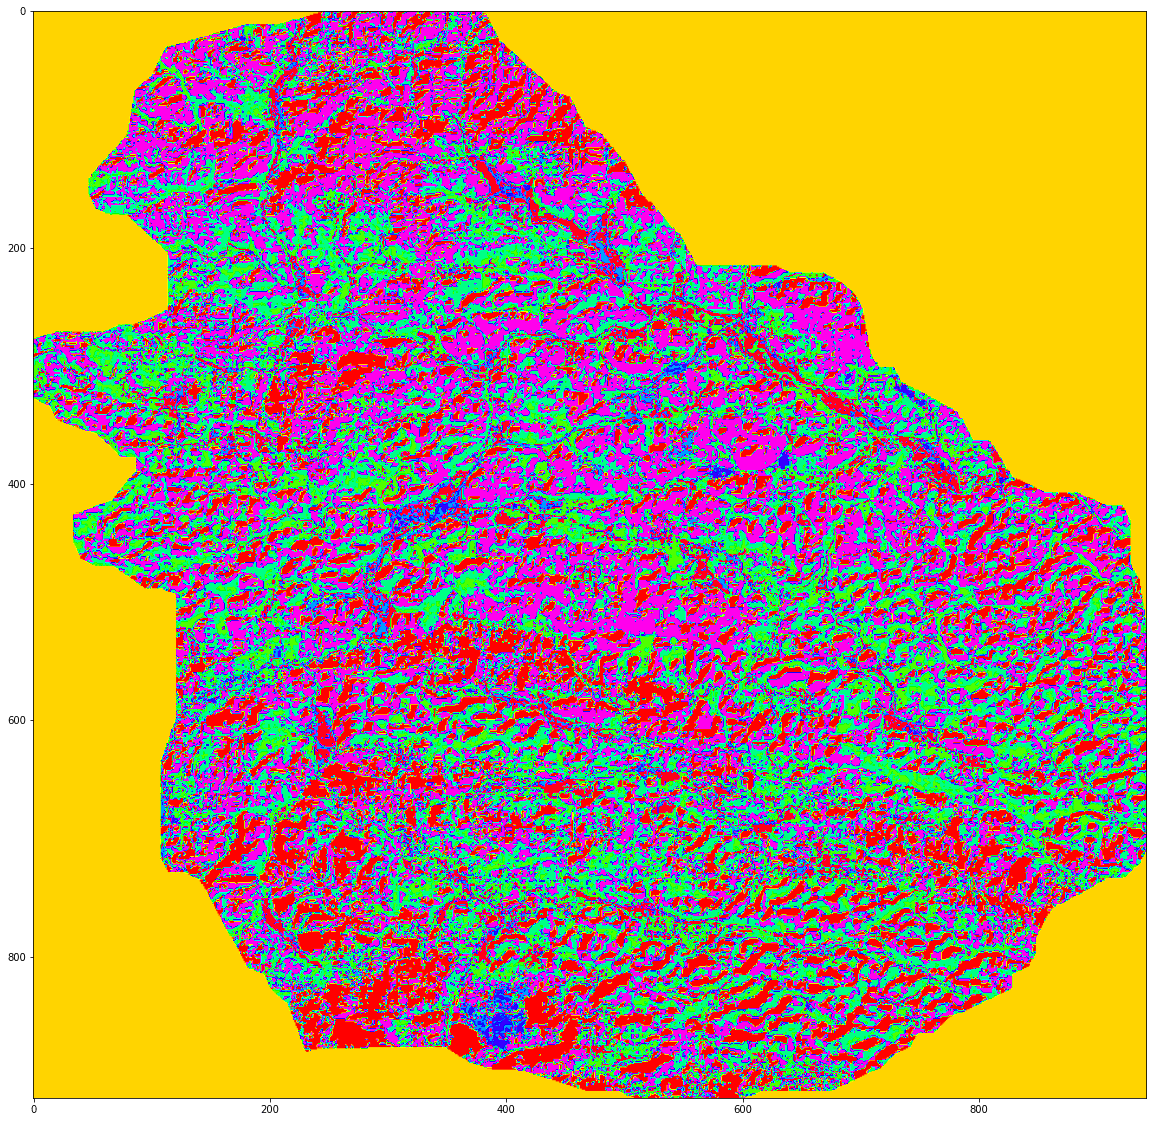
plt.figure(figsize=(20,20))
plt.imshow(X_cluster, cmap="hsv")

plt.show()

MB_KMeans = cluster.MiniBatchKMeans(n_clusters=8)
MB_KMeans.fit(X)
X_cluster = MB_KMeans.labels_
X_cluster = X_cluster.reshape(img[:, :, 0].shape)
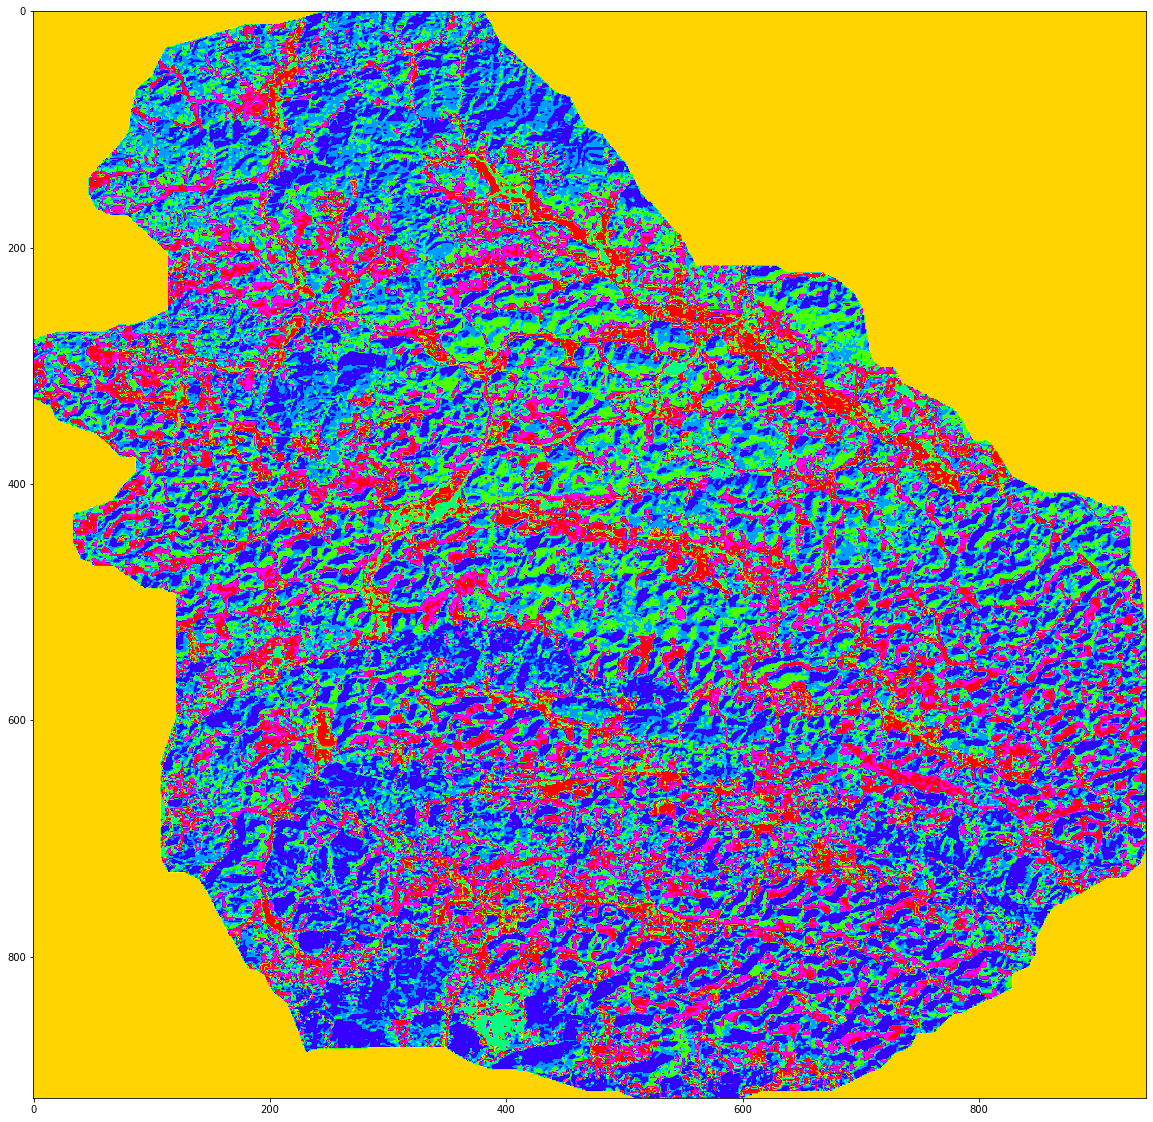
plt.figure(figsize=(20,20))
plt.imshow(X_cluster, cmap="hsv")

plt.show()

保存至硬盘
out_img = driver.Create("E:/Desktop/test.tif", rows, cols, 1, gdal.GDT_Byte)
out_img.SetGeoTransform(trans)
out_img.SetProjection(proj)
out_img.GetRasterBand(1).WriteArray(X_cluster)
out_img.FlushCache()