前言:参考 [AntV X6 官网](https://x6.antv.antgroup.com/)
一、简介
X6 可以快速搭建 DAG 图、ER 图、流程图、血缘图等应用。
二、快速上手
1. 安装
npm install @antv/x6 --save

# or

yarn add @antv/x6

# or

pnpm add @antv/x6
2. 使用
2.1 初始画布
在页面中创建一个画布容器,然后初始化画布对象,可以通过配置设置画布的样式,比如背景颜色。
<script setup lang="ts">

  import { Graph } from "@antv/x6";


  const graph = new Graph({

    container: document.getElementById("container"),

    width: 800,

    height: 600,

    background: {

      color: "#F2F7FA",

    },

  });

</script>


<template>

  <div id="container"></div>

</template>


<style lang="scss" scoped></style>
2.2 渲染节点和边
X6 支持 JSON 格式数据,该对象中 nodes 代表节点数据,edges 代表边数据,可以使用 attrs 属性来定制节点和边的样式(可以类比 CSS)。
<script setup lang="ts">

  import { onMounted } from "vue";

  import { Graph } from "@antv/x6";


  const data = {

    nodes: [

      {

        id: "node1",

        shape: "rect",

        x: 40,

        y: 40,

        width: 100,

        height: 40,

        label: "hello",

        attrs: {

          // body 是选择器名称,选中的是 rect 元素

          body: {

            stroke: "#8f8f8f",

            strokeWidth: 1,

            fill: "#fff",

            rx: 6,

            ry: 6,

          },

        },

      },

      {

        id: "node2",

        shape: "rect",

        x: 160,

        y: 180,

        width: 100,

        height: 40,

        label: "world",

        attrs: {

          body: {

            stroke: "#8f8f8f",

            strokeWidth: 1,

            fill: "#fff",

            rx: 6,

            ry: 6,

          },

        },

      },

    ],

    edges: [

      {

        shape: "edge",

        source: "node1",

        target: "node2",

        label: "x6",

        attrs: {

          // line 是选择器名称,选中的边的 path 元素

          line: {

            stroke: "#8f8f8f",

            strokeWidth: 1,

          },

        },

      },

    ],

  };


  onMounted(() => {

    const graph = new Graph({

      container: document.getElementById("container"),

      width: 800,

      height: 600,

      background: {

        color: "#F2F7FA",

      },

    });

    graph.fromJSON(data); // 渲染元素

    graph.centerContent(); // 居中显示

  });

</script>


<template>

  <div id="container"></div>

</template>


<style lang="scss" scoped></style>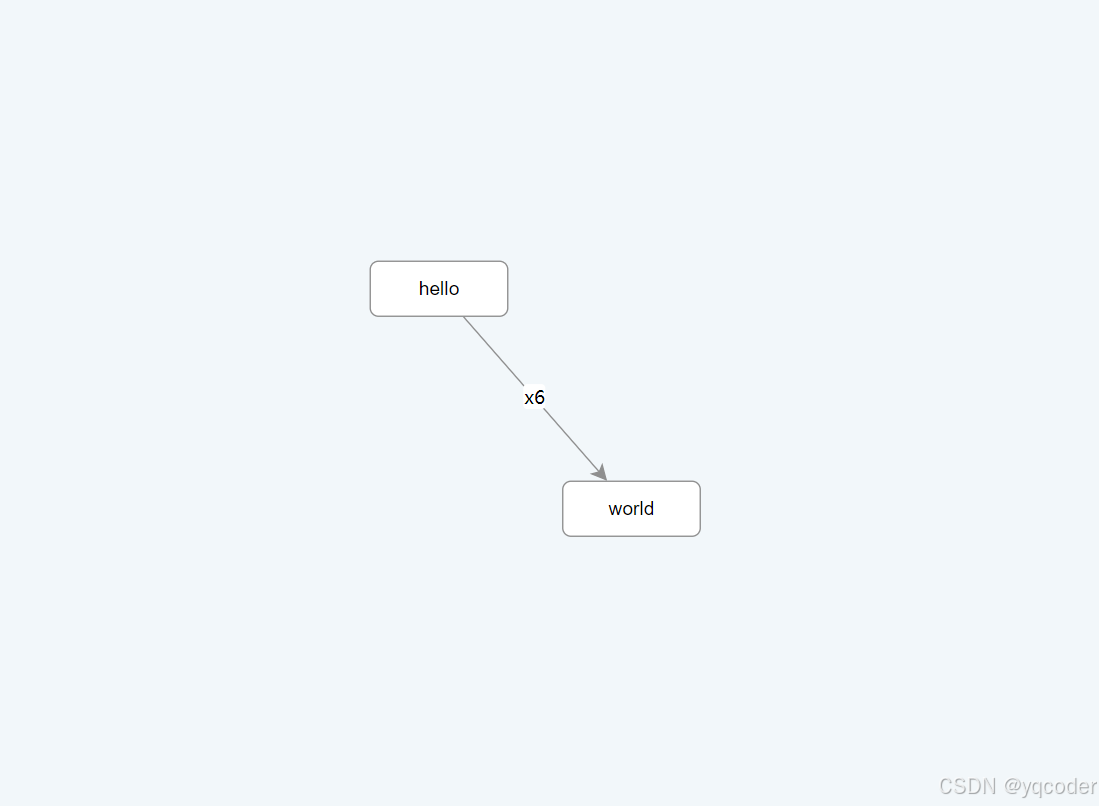
2.3 数据导出
使用 fromJSON 将 JSON 数据渲染到画布中,使用 toJSON 将画布中数据导出成 JSON,这样我们就可以将画布数据序列化后存储到服务端。
graph.toJSON();三、基础
1. 画布
1.1 画布大小
h 设置 width、height,不设置以容器大小初始画布。设置 autoResize,外层再嵌套一层宽高 100%的容器用来自适应窗口大小。
<script setup lang="ts">

  import { onMounted } from "vue";

  import { Graph } from "@antv/x6";


  onMounted(() => {

    const graph = new Graph({

      container: document.getElementById("container"),

      autoResize: true,

    });

  });

</script>


<template>

  <div style="width: 100%; height: 100%">

    <div id="container"></div>

  </div>

</template>


<style lang="scss" scoped></style>
1.2 背景与网格
可以通过 background 和 grid 两个配置来设置画布的背景以及网格。
const graph = new Graph({

  container: this.container,

  background: {

    color: "#F2F7FA",

  },

  grid: {

    visible: true,

    type: "doubleMesh",

    args: [

      {

        color: "#eee", // 主网格线颜色

        thickness: 1, // 主网格线宽度

      },

      {

        color: "#ddd", // 次网格线颜色

        thickness: 1, // 次网格线宽度

        factor: 4, // 主次网格线间隔

      },

    ],

  },

});
1.3 缩放与平移
设置 panning 拖拽、mousewheel 缩放
const graph = new Graph({

  panning: true,

  mousewheel: true,

});
1.4 常用 API
graph.resize(800, 600):重置画布大小
graph.zoom(0.2):将画布缩放级别增加 0.2(默认为 1)
graph.zoom(-0.2):将画布缩放级别减少 0.2
graph.zoomTo(1.2):将画布缩放级别设置为 1.2
graph.zoomToFit({ maxScale: 1 }):将画布中元素缩小或者放大一定级别,让画布正好容纳所有元素,可以通过 maxScale 配置最大缩放级别
graph.centerContent():将画布中元素居中展示
2. 节点
2.1 添加节点
graph.addNode({

  shape: "rect", // 节点形状

  x: 100, // 节点位置 x 坐标,单位为 px。

  y: 40, // 节点位置 y 坐标,单位为 px。

  width: 100, // 节点宽度,单位为 px。

  height: 40, // 节点高度,单位为 px。

  angle: 0, // 节点旋转角度。

});
2.2 内置节点
X6 内置节点形状:rect 矩形、circle 圆形、ellipse 椭圆、polygon 多边形、polyline 折线、path 路径、image 图片
// 公用样式

const commonAttrs = {

  body: {

    fill: "#fff",

    stroke: "#8f8f8f",

    strokeWidth: 1,

  },

  label: {

    refX: 0.5,

    refY: "100%",

    refY2: 4,

    textAnchor: "middle",

    textVerticalAnchor: "top",

  },

};

// rect 矩形

graph.addNode({

  shape: "rect",

  x: 40,

  y: 40,

  width: 80,

  height: 40,

  label: "rect",

  attrs: commonAttrs,

});

// circle 圆形

graph.addNode({

  shape: "circle",

  x: 180,

  y: 40,

  width: 40,

  height: 40,

  label: "circle",

  attrs: commonAttrs,

});

// ellipse 椭圆

graph.addNode({

  shape: "ellipse",

  x: 280,

  y: 40,

  width: 80,

  height: 40,

  label: "ellipse",

  attrs: commonAttrs,

});

// path 路径

graph.addNode({

  shape: "path",

  x: 420,

  y: 40,

  width: 40,

  height: 40,

  // https://www.svgrepo.com/svg/13653/like

  path: "M24.85,10.126c2.018-4.783,6.628-8.125,11.99-8.125c7.223,0,12.425,6.179,13.079,13.543c0,0,0.353,1.828-0.424,5.119c-1.058,4.482-3.545,8.464-6.898,11.503L24.85,48L7.402,32.165c-3.353-3.038-5.84-7.021-6.898-11.503c-0.777-3.291-0.424-5.119-0.424-5.119C0.734,8.179,5.936,2,13.159,2C18.522,2,22.832,5.343,24.85,10.126z",

  attrs: commonAttrs,

  label: "path",

});

// polygon 多边形

graph.addNode({

  shape: "polygon",

  x: 60,

  y: 150,

  width: 40,

  height: 40,

  points: "100,10 40,198 190,78 10,78 160,198",

  attrs: commonAttrs,

  label: "polygon",

});

// polyline 折线

graph.addNode({

  shape: "polyline",

  x: 180,

  y: 150,

  width: 40,

  height: 40,

  label: "polyline",

  attrs: {

    body: {

      ...commonAttrs.body,

      refPoints: "0,0 0,10 10,10 10,0",

    },

    label: commonAttrs.label,

  },

});

// image 图片

graph.addNode({

  shape: "image",

  x: 290,

  y: 150,

  width: 60,

  height: 40,

  imageUrl:

    "https://gw.alipayobjects.com/os/s/prod/antv/assets/image/logo-with-text-73b8a.svg",

  label: "image",

  attrs: commonAttrs,

});
2.3 定制节点
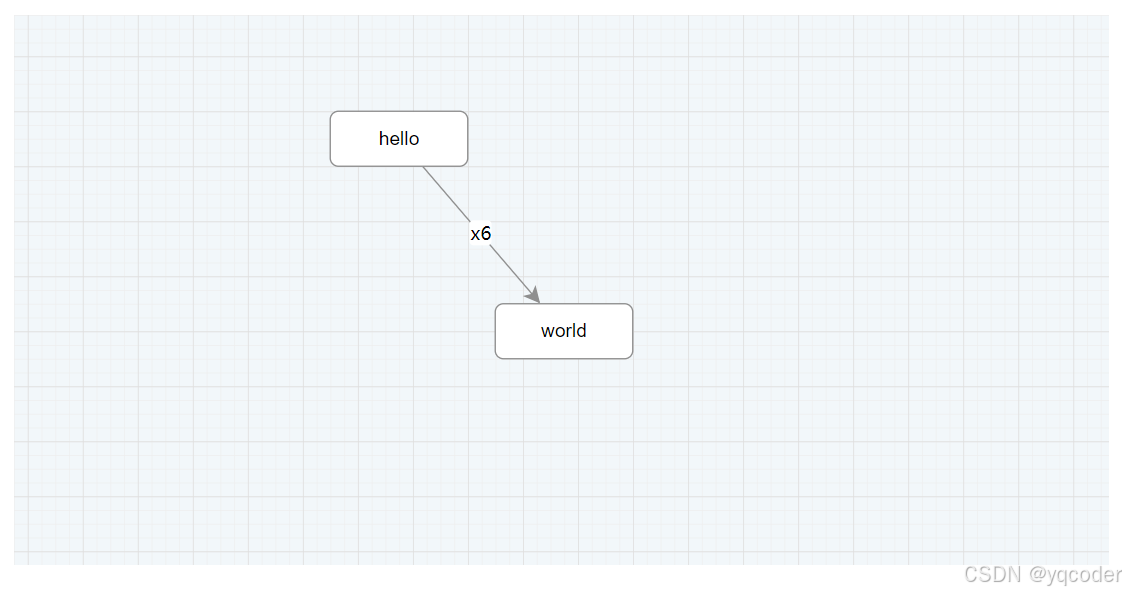
使用 Graph.registerNode(NodeName, options, true) 注册节点。
Graph.registerNode(

  "custom-node",

  {

    inherit: "rect", // 继承于 rect 节点

    width: 100,

    height: 40,

    markup: [

      {

        tagName: "rect", // 标签名称

        selector: "body", // 选择器

      },

      {

        tagName: "image",

        selector: "img",

      },

      {

        tagName: "text",

        selector: "label",

      },

    ],

    attrs: {

      body: {

        stroke: "#8f8f8f",

        strokeWidth: 1,

        fill: "#fff",

        rx: 6,

        ry: 6,

      },

      img: {

        "xlink:href":

          "https://gw.alipayobjects.com/zos/antfincdn/FLrTNDvlna/antv.png",

        width: 16,

        height: 16,

        x: 12,

        y: 12,

      },

    },

  },

  true

);


const source = graph.addNode({

  shape: "custom-node", // 可以直接使用上面注册过的 shape

  x: 40,

  y: 40,

  label: "hello",

});


const target = graph.addNode({

  shape: "custom-node",

  x: 160,

  y: 180,

  label: "world",

});


graph.addEdge({

  source,

  target,

  attrs: {

    line: {

      stroke: "#8f8f8f",

      strokeWidth: 1,

    },

  },

});
2.4 修改节点
node.prop(path, value) 修改结构,node.attr(path, value) 修改样式。
const node = graph.addNode({

  shape: 'rect',

  width: 100,

  height: 40,

  x: 100,

  y: 100,

  label: 'edge',

})

console.log(node.prop())


// 结果

{

  "angle": 0,

  "position": {

    "x": 100,

    "y": 100

  },

  "size": {

    "width": 100,

    "height": 40

  },

  "attrs": {

    "text": {

      "fontSize": 14,

      "fill": "#000000",

      "refX": 0.5,

      "refY": 0.5,

      "textAnchor": "middle",

      "textVerticalAnchor": "middle",

      "fontFamily": "Arial, helvetica, sans-serif",

      "text": "node"

    },

    "rect": {

      "fill": "#ffffff",

      "stroke": "#333333",

      "strokeWidth": 2

    },

    "body": {

      "refWidth": "100%",

      "refHeight": "100%"

    }

  },

  "visible": true,

  "shape": "rect",

  "id": "ab47cadc-4104-457c-971f-50fbb077508a",

  "zIndex": 1

}


node.prop('size', { width: 120, height: 50 }) // 修改 x 坐标

node.attr('rect/fill', '#ccc') // 修改填充色,等价于 node.prop('attrs/rect/fill', '#ccc')
3. 边
3.1 添加边
除了从 Cell 继承属性外,还支持以下选项
source 源节点或起始点。
target 目标节点或目标点。
vertices 路径点。
router 路由。
connector 连接器。
labels 标签。
defaultLabel 默认标签。
graph.addEdge({

  shape: "edge",

  source: "node1",

  target: "node2",

});
3.2 配置边
3.2.1 source/target
边的源和目标节点(点)
graph.addEdge({

  source: rect1, // 源节点

  target: rect2, // 目标节点

});


graph.addEdge({

  source: "rect1", // 源节点 ID

  target: "rect2", // 目标节点 ID

});


graph.addEdge({

  source: { cell: rect1, port: "out-port-1" }, // 源节点和连接桩 ID

  target: { cell: "rect2", port: "in-port-1" }, // 目标节点 ID 和连接桩 ID

});


graph.addEdge({

  source: "rect1", // 源节点 ID

  target: { x: 100, y: 120 }, // 目标点

});
3.2.2 vertices
路径点。边从起始点开始,按顺序经过路径点,最后到达终止点。
graph.addEdge({

  source: rect1,

  target: rect2,

  vertices: [

    { x: 100, y: 200 },

    { x: 300, y: 120 },

  ],

});
3.2.3 router
路由 router 将对 vertices 进一步处理,并在必要时添加额外的点,然后返回处理后的点。例如,经过 orth 路由处理后,边的每一条链接线段都是水平或垂直的。
内置路由:normal、orth、oneSide、manhattan、metro、er、自定义路由
graph.addEdge({

  source: rect1,

  target: rect2,

  vertices: [

    { x: 100, y: 200 },

    { x: 300, y: 120 },

  ],

  // 如果没有 args 参数,可以简写为 router: 'orth'

  router: {

    name: "orth",

    args: {},

  },

});
3.2.4 connector
连接器 connector 将路由 router 返回的点加工成渲染边所需要的 pathData。例如,rounded 连接器将连线之间的倒角处理为圆弧倒角。
内置连接器:normal、rounded、smooth、jumpover、自定义连接器
graph.addEdge({

  source: rect1,

  target: rect2,

  vertices: [

    { x: 100, y: 200 },

    { x: 300, y: 120 },

  ],

  router: "orth",

  // 如果没有 args 参数,可以简写写 connector: 'rounded'

  connector: {

    name: "rounded",

    args: {},

  },

});
3.2.5 labels
用于设置标签文本、位置、样式等。通过数组形式支持多标签,labels 指定的每一项都将与 defaultLabel 进行 merge 后使用。
const edge = graph.addEdge({

  source: rect1,

  target: rect2,

  labels: [

    {

      attrs: {

        label: {

          text: "edge",

        },

      },

    },

  ],

});

// 或

const edge = graph.addEdge({

  source: rect1,

  target: rect2,

  labels: ["edge"], // 通过 labels 可以设置多个标签,当只设置标签文本是可以简化为此写法

});

// 或

const edge = graph.addEdge({

  source: rect1,

  target: rect2,

  label: "edge", // 通过 label 设置单个标签,当只设置标签文本是可以简化为此写法

});
3.2.6 defaultLabel
默认标签。默认标签可以简化标签配置项,labels 指定的每一项都将与 defaultLabel 进行 merge 后使用。
3.3 使用箭头
我们定义了 sourceMarker 和 targetMarker 两个特殊属性来为边定制起始和终止箭头。例如,对 Shape.Edge 我们可以通过 line 选择器来指定起始和终止箭头。
3.3.1 内置箭头
block、classic、diamond、cross、async、path、circle、circlePlus、ellipse
graph.addEdge({

  shape: "edge",

  sourece: [100, 100],

  target: [500, 500],

  attrs: {

    line: {

      sourceMarker: "block", // 实心箭头

      targetMarker: {

        name: "ellipse", // 椭圆

        rx: 10, // 椭圆箭头的 x 半径

        ry: 6, // 椭圆箭头的 y 半径

      },

    },

  },

});
3.3.2 自定义箭头
我们也可以通过 tagName 指定的 SVG 元素来渲染箭头,例如下面我们使用 <path> 元素来渲染箭头,箭头默认继承边的填充色 fill 和边框色 stroke。
graph.addEdge({

  shape: "edge",

  sourece: [100, 100],

  target: [500, 500],

  attrs: {

    line: {

      sourceMarker: {

        tagName: "path",

        d: "M 20 -10 0 0 20 10 Z",

      },

      targetMarker: {

        tagName: "path",

        fill: "yellow", // 使用自定义填充色

        stroke: "green", // 使用自定义边框色

        strokeWidth: 2,

        d: "M 20 -10 0 0 20 10 Z",

      },

    },

  },

});
3.4 定制边
和节点一样,我们可以通过 markup 和 attrs 来定制边的形状和样式,也可以注册自定义边来达到复用效果。
Graph.registerEdge("double-edge", {

  inherit: "edge",

  markup: [

    {

      tagName: "path",

      selector: "outline",

      attrs: {

        fill: "none",

      },

    },

    {

      tagName: "path",

      selector: "line",

      attrs: {

        fill: "none",

        cursor: "pointer",

      },

    },

  ],

  attrs: {

    line: {

      connection: true,

      stroke: "#dddddd",

      strokeWidth: 4,

      strokeLinejoin: "round",

      targetMarker: {

        tagName: "path",

        stroke: "#000000",

        d: "M 10 -3 10 -10 -2 0 10 10 10 3",

      },

    },

    outline: {

      connection: true,

      stroke: "#000000",

      strokeWidth: 6,

      strokeLinejoin: "round",

    },

  },

});


graph.addEdge({

  shape: "double-edge",

  source: [100, 100],

  target: [400, 100],

});
3.5 修改边
和节点类似,在渲染完成之后,我们还可以通过 API 修改边的所有属性。edge.prop(path, value) 修改边布局,edge.attr(path, value) 修改边样式
const edge = graph.addEdge({

  source: [200, 140],

  target: [500, 140],

  label: 'edge',

})

console.log(edge.prop())


// 输出结果

{

  "shape": "edge",

  "attrs": {

    "lines": {

      "connection": true,

      "strokeLinejoin": "round"

    },

    "wrap": {

      "strokeWidth": 10

    },

    "line": {

      "stroke": "#333",

      "strokeWidth": 2,

      "targetMarker": "classic"

    }

  },

  "id": "9d5e4f54-1ed3-429e-8d8c-a1526cff2cd8",

  "source": {

    "x": 200,

    "y": 140

  },

  "target": {

    "x": 500,

    "y": 140

  },

  "labels": [{

    "attrs": {

      "label": {

        "text": "edge"

      }

    }

  }],

  "zIndex": 1

}


edge.prop('target', { x: 300, y: 300 }) // 修改终点

edge.attr('line/stroke', '#ccc') // 修改边颜色,等价于 edge.prop('attrs/line/stroke', '#ccc')
4. 连接桩
4.1 配置连接桩
在注册节点的时候通过 ports 配置连接桩
Graph.registerNode(

  "custom-node-width-port",

  {

    inherit: "rect",

    width: 100,

    height: 40,

    attrs: {

      body: {

        stroke: "#8f8f8f",

        strokeWidth: 1,

        fill: "#fff",

        rx: 6,

        ry: 6,

      },

    },

    ports: {

      groups: {

        top: {

          position: "top",

          attrs: {

            circle: {

              magnet: true,

              stroke: "#8f8f8f",

              r: 5,

            },

          },

        },

        bottom: {

          position: "bottom",

          attrs: {

            circle: {

              magnet: true,

              stroke: "#8f8f8f",

              r: 5,

            },

          },

        },

      },

    },

  },

  true

);


const source = graph.addNode({

  shape: "custom-node-width-port",

  x: 40,

  y: 40,

  label: "hello",

  ports: {

    items: [

      {

        id: "port_1",

        group: "bottom",

      },

      {

        id: "port_2",

        group: "bottom",

      },

    ],

  },

});


const target = graph.addNode({

  shape: "custom-node-width-port",

  x: 160,

  y: 180,

  label: "world",

  ports: {

    items: [

      {

        id: "port_3",

        group: "top",

      },

      {

        id: "port_4",

        group: "top",

      },

    ],

  },

});


graph.addEdge({

  source: { cell: source, port: "port_2" },

  target: { cell: target, port: "port_3" },

  attrs: {

    line: {

      stroke: "#8f8f8f",

      strokeWidth: 1,

    },

  },

});
4.2 修改连接桩
节点上有丰富的 API 对连接桩进行增、删、改操作。
// 添加连接桩

node.addPort({

  group: "top",

  attrs: {

    text: {

      text: "xx",

    },

  },

});


// 删除连接桩

node.removePort(portId);


// 更新连接桩

node.portProp(portId, "attrs/circle/stroke", color);
4.3 连接桩位置
连接桩布局算法只能通过 groups 中的 position 选项来指定
absolute 绝对定位。
left 矩形节点左侧均匀分布。
right 矩形节点右侧均匀分布。
top 矩形节点顶部均匀分布。
bottom 矩形节点底部均匀分布。
line 沿指定的线均匀分布。
ellipse 沿椭圆圆弧分布。
ellipseSpread 沿椭圆均匀分布。
4.4 连接桩标签位置
在 groups 的 label.position 选项和节点的 items.label.position 选项中都可以指定标签的位置。
left 标签位于连接桩左侧。
right 标签位于连接桩右侧。
top 标签位于连接桩上方。
bottom 标签位于连接桩下方。
inside 标签位于节点内围(靠近边线的内侧)。
outside 标签位于节点外围(靠近边线的外侧)。
insideOriented 标签位于节点内围,而且根据所在方位自动调整文本的方向。
outsideOriented 标签位于节点外围,而且根据所在方位自动调整文本的方向。
radial 标签位于圆形或椭圆形节点的外围。
radialOriented 标签位于圆形或椭圆形节点的外围,并使标签文本自动沿圆弧方向旋转。
5. 交互
5.1 连线
连线交互规则都是通过 connecting 配置来完成。下面介绍一些常用的功能。
5.1.1 allowXXX
可以通过 allowXXX 配置来定义连线能否连接到对应的位置。默认支持以下项:
allowBlank:是否允许连接到画布空白位置的点,默认为 true。
allowLoop:是否允许创建循环连线,即边的起始节点和终止节点为同一节点,默认为 true。
allowNode:是否允许边连接到节点(非节点上的连接桩),默认为 true。
allowEdge:是否允许边连接到另一个边,默认为 true。
allowPort:是否允许边连接到连接桩,默认为 true。
allowMulti:是否允许在相同的起始节点和终止之间创建多条边,默认为 true。
new Graph({

  connecting: {

    allowNode: true, // boolean

  },

});


// 函数形式,多用于动态控制连接限制

new Graph({

  connecting: {

    allowNode(args) {

      return true;

    },

  },

});
5.1.2 router/connector
在边教程中我们知道,可以在添加边的时候指定 router 和 connector,如果整个画布中大部分边的 router 或者 connector 是一样的,我们可以直接配置在 connecting 中,这样就可以避免在边中重复配置。
new Graph({

  connecting: {

    router: "orth",

    connector: "rounded",

  },

});
5.1.3 createEdge
在上面的 demo 中,我们可以从节点、连接桩拉出一条连线出来,那你可能会问,什么样的元素能拉出连线呢?这是 X6 设计非常巧妙的一个地方,只要具备 magnet=true 属性的元素,都可以拉出连线。而且在 connecting 中可以通过 createEdge 方法配置拉出连线的样式。
new Graph({

  connecting: {

    createEdge() {

      return this.createEdge({

        shape: "edge",

        attrs: {

          line: {

            stroke: "#8f8f8f",

            strokeWidth: 1,

          },

        },

      });

    },

  },

});
5.2 组合
有时候我们需要将一个节点拖动到另一个节点中,使其成为另一节点的子节点,这时我们可以通过 embedding 选项来开启,在节点被移动时通过 findParent 指定的方法返回父节点。
const graph = new Graph({

  embedding: {

    enabled: true,

    findParent({ node }) {

      // 获取移动节点的包围盒

      const bbox = node.getBBox()

      // 找到 data 中配置 { parent: true } 的节点,并且移动节点和找到的节点包围盒相交时,返回 true

      return this.getNodes().filter((node) => {

        const data = node.getData<{ parent: boolean }>()

        if (data && data.parent) {

          const targetBBox = node.getBBox()

          return bbox.isIntersectWithRect(targetBBox)

        }

        return false

      })

    },

  },

})
5.3 高亮
可以通过 highlighting 选项来指定触发某种交互时的高亮样式,如:
new Graph({

  highlighting: {

    // 连接桩可以被连接时在连接桩外围围渲染一个包围框

    magnetAvailable: {

      name: "stroke",

      args: {

        attrs: {

          fill: "#fff",

          stroke: "#A4DEB1",

          strokeWidth: 4,

        },

      },

    },

    // 连接桩吸附连线时在连接桩外围围渲染一个包围框

    magnetAdsorbed: {

      name: "stroke",

      args: {

        attrs: {

          fill: "#fff",

          stroke: "#31d0c6",

          strokeWidth: 4,

        },

      },

    },

  },

});
支持的 highlighting 配置项有:
default 默认高亮选项,当以下几种高亮配置缺省时被使用。
embedding 拖动节点进行嵌入操作过程中,节点可以被嵌入时被使用。
nodeAvailable 连线过程中,节点可以被链接时被使用。
magnetAvailable 连线过程中,连接桩可以被链接时被使用。
magnetAdsorbed 连线过程中,自动吸附到连接桩时被使用。
5.4 交互限制
可以通过配置 interacting 来启动、禁用一些元素的交互行为,如果画布上元素纯预览,不能进行任何交互,可以直接设置为 false。
new Graph({

  interacting: false,

});
如果需要更细节的定义允许哪些交互、禁用哪些交互,我们可以针对不同的属性值进行配置,支持的属性包括:
nodeMovable 节点是否可以被移动。
magnetConnectable 当在具有 magnet 属性的元素上按下鼠标开始拖动时,是否触发连线交互。
edgeMovable 边是否可以被移动。
edgeLabelMovable 边的标签是否可以被移动。
arrowheadMovable 边的起始/终止箭头(在使用 arrowhead 工具后)是否可以被移动。
vertexMovable 边的路径点是否可以被移动。
vertexAddable 是否可以添加边的路径点。
vertexDeletable 边的路径点是否可以被删除。
6. 事件
6.1 视图交互事件
通过鼠标、键盘或者各种可交互的组件与应用产生交互时触发的事件。
6.1.1 鼠标事件
单击 cell:click node:click node:port:click edge:click blank:click
双击 cell:dblclick node:dblclick node:port:dblclick edge:dblclick blank:dblclick
右键 cell:contextmenu node:contextmenu node:port:contextmenu edge:contextmenu blank:contextmenu
鼠标按下 cell:mousedown node:mousedown node:port:mousedown edge:mousedown blank:mousedown
移动鼠标 cell:mousemove node:mousemove node:port:mousemove edge:mousemove blank:mousemove
鼠标抬起 cell:mouseup node:mouseup node:port:mouseup edge:mouseup blank:mouseup
鼠标滚轮 cell:mousewheel node:mousewheel - edge:mousewheel blank:mousewheel
鼠标进入 cell:mouseenter node:mouseenter node:port:mouseenter edge:mouseenter graph:mouseenter
鼠标离开 cell:mouseleave node:mouseleave node:port:mouseleave edge:mouseleave graph:mouseleave
除了 mouseenter 和 mouseleave 外,事件回调函数的参数都包含鼠标相对于画布的位置 x、y 和鼠标事件对象 e 等参数。
graph.on("cell:click", ({ e, x, y, cell, view }) => {});

graph.on("node:click", ({ e, x, y, node, view }) => {});

graph.on("edge:click", ({ e, x, y, edge, view }) => {});

graph.on("blank:click", ({ e, x, y }) => {});


graph.on("cell:mouseenter", ({ e, cell, view }) => {});

graph.on("node:mouseenter", ({ e, node, view }) => {});

graph.on("edge:mouseenter", ({ e, edge, view }) => {});

graph.on("graph:mouseenter", ({ e }) => {});
6.1.2 自定义点击事件
我们可以在节点/边的 DOM 元素上添加自定义属性 event 或 data-event 来监听该元素的点击事件,例如:
node.attr({

  // 表示一个删除按钮,点击时删除该节点

  image: {

    event: "node:delete",

    xlinkHref: "trash.png",

    width: 20,

    height: 20,

  },

});
可以通过绑定的事件名 node:delete 或通用的 cell:customevent、node:customevent、edge:customevent 事件名来监听。
graph.on("node:delete", ({ view, e }) => {

  e.stopPropagation();

  view.cell.remove();

});


graph.on("node:customevent", ({ name, view, e }) => {

  if (name === "node:delete") {

    e.stopPropagation();

    view.cell.remove();

  }

});
6.1.3 画布缩放/平移
事件名 回调参数 说明
scale { sx: number; sy: number; ox: number; oy: number } 缩放画布时触发,sx 和 sy 是缩放比例,ox 和 oy 是缩放中心。
resize { width: number; height: number } 改变画布大小时触发,width 和 height 是画布大小。
translate { tx: number; ty: number } 平移画布时触发,tx 和 ty 分别是 X 和 Y 轴的偏移量。
graph.on("scale", ({ sx, sy, ox, oy }) => {});

graph.on("resize", ({ width, height }) => {});

graph.on("translate", ({ tx, ty }) => {});
6.1.4 节点或边平移
事件名 回调参数 说明
node:move { e: Dom.MouseDownEvent; x: number; y: number; node: Node; view: NodeView } 开始移动节点时触发。
node:moving { e: Dom.MouseMoveEvent; x: number; y: number; node: Node; view: NodeView } 移动节点时触发。
node:moved { e: Dom.MouseUpEvent; x: number; y: number; node: Node; view: NodeView } 移动节点后触发。
edge:move { e: Dom.MouseDownEvent; x: number; y: number; node: Node; view: NodeView } 开始移动边时触发。
edge:moving { e: Dom.MouseMoveEvent; x: number; y: number; node: Node; view: NodeView } 移动边时触发。
edge:moved { e: Dom.MouseUpEvent; x: number; y: number; node: Node; view: NodeView } 移动边后触发。
参数中的 x 和 y 是鼠标相对于画布的坐标。
graph.on("node:moved", ({ e, x, y, node, view }) => {});6.1.5 节点嵌入
事件名 回调参数 说明
node:embed { e: Dom.MouseDownEvent; x: number; y: number; node: Node; view: NodeView, currentParent: Node } 开启嵌入,在开始拖动节点时触发。
node:embedding { e: Dom.MouseMoveEvent; x: number; y: number; node: Node; view: NodeView, currentParent: Node, candidateParent: Node } 寻找目标节点过程中触发。
node:embedded { e: Dom.MouseUpEvent; x: number; y: number; node: Node; view: NodeView, previousParent: Node, currentParent: Node } 完成节点嵌入后触发。
6.1.6 边连接/取消连接
当拖动边的起始/终止箭头将边连接到节点/边或者将边从节点/边上分离后触发 edge:connected。
我们可以通过 isNew 来判断连线完成后,对应的边是否是新创建的边。比如从一个连接桩开始,创建了一条边并连接到另一个节点/连接桩,此时 isNew 就为 true。
graph.on("edge:connected", ({ isNew, edge }) => {

  if (isNew) {

    // 对新创建的边进行插入数据库等持久化操作

  }

});
特别注意的是,参数中的 previous... 是记录操作终端在连接/取消连接之前的状态,并不是指 sourceCell,在创建新边后获取 sourceCell 时不能使用 previousCell,正确的使用方式是:
graph.on("edge:connected", ({ isNew, edge }) => {

  if (isNew) {

    const source = edge.getSourceCell();

  }

});
6.2 节点/边
6.2.1 添加/删除/修改
当节点/边被添加到画布时,触发以下事件:
added
cell:added
node:added(仅当 cell 是节点时才触发)
edge:added(仅当 cell 是边时才触发)
当节点/边被移除时,触发以下事件:
removed
cell:removed
node:removed(仅当 cell 是节点时才触发)
edge:removed(仅当 cell 是边时才触发)
当节点/边发生任何改变时,触发以下事件:
changed
cell:changed
node:changed(仅当 cell 是节点时才触发)
edge:changed(仅当 cell 是边时才触发)
可以在节点/边上监听:
cell.on("added", ({ cell, index, options }) => {});

cell.on("removed", ({ cell, index, options }) => {});

cell.on("changed", ({ cell, options }) => {});
或者在 Graph 上监听:
graph.on("cell:added", ({ cell, index, options }) => {});

graph.on("cell:removed", ({ cell, index, options }) => {});

graph.on("cell:changed", ({ cell, options }) => {});


graph.on("node:added", ({ node, index, options }) => {});

graph.on("node:removed", ({ node, index, options }) => {});

graph.on("node:changed", ({ node, options }) => {});


graph.on("edge:added", ({ edge, index, options }) => {});

graph.on("edge:removed", ({ edge, index, options }) => {});

graph.on("edge:changed", ({ edge, options }) => {});
6.2.2 change:xxx
当调用 setXxx(val, options) 和 removeXxx(options) 方法去改变节点/边的数据时,并且 options.silent 不为 true 时,都将触发对应的 change 事件,并触发节点/边重绘。例如:
cell.setZIndex(2);

cell.setZIndex(2, { silent: false });

cell.setZIndex(2, { anyKey: "anyValue" });
6.3 动画
transition:start 动画开始时触发
transition:progress 动画过程中触发
transition:complete 动画完成时触发
transition:stop 动画被停止时触发
transition:finish 动画完成或被停止时触发
cell.on("transition:start", (args: Animation.CallbackArgs) => {});

cell.on("transition:progress", (args: Animation.ProgressArgs) => {});

cell.on("transition:complete", (args: Animation.CallbackArgs) => {});

cell.on("transition:stop", (args: Animation.StopArgs) => {});

cell.on("transition:finish", (args: Animation.CallbackArgs) => {});


graph.on("cell:transition:start", (args: Animation.CallbackArgs) => {});

graph.on("cell:transition:progress", (args: Animation.ProgressArgs) => {});

graph.on("cell:transition:complete", (args: Animation.CallbackArgs) => {});

graph.on("cell:transition:stop", (args: Animation.StopArgs) => {});

graph.on("cell:transition:finish", (args: Animation.CallbackArgs) => {});


graph.on("node:transition:start", (args: Animation.CallbackArgs) => {});

graph.on("node:transition:progress", (args: Animation.ProgressArgs) => {});

graph.on("node:transition:complete", (args: Animation.CallbackArgs) => {});

graph.on("node:transition:stop", (args: Animation.StopArgs) => {});

graph.on("node:transition:finish", (args: Animation.CallbackArgs) => {});


graph.on("edge:transition:start", (args: Animation.CallbackArgs) => {});

graph.on("edge:transition:progress", (args: Animation.ProgressArgs) => {});

graph.on("edge:transition:complete", (args: Animation.CallbackArgs) => {});

graph.on("edge:transition:stop", (args: Animation.StopArgs) => {});

graph.on("edge:transition:finish", (args: Animation.CallbackArgs) => {});
6.4 视图
由于 X6 实现了异步的渲染调度算法,所以节点的添加不一定意味着挂载到画布上。节点在被挂载到画布时以及从画布上卸载时会分别触发单独的事件。
事件名 回调参数 说明
view:mounted { view: CellView } 节点被挂载到画布上时触发。
view:unmounted { view: CellView } 节点从画布上卸载时触发。
graph.on("view:mounted", ({ view }) => {});

graph.on("view:unmounted", ({ view }) => {});
大家还有经常需要在调用 fromJSON 或者 resetCells 后监听画布完成渲染事件,这时候可以使用 render:done 事件来监听
graph.on('render:done', () => {

  // pass

})


graph.fromJSON([...])
7. 数据
7.1 导出
我们可以调用 graph.toJSON() 方法来导出图中的节点和边,返回一个具有 { cells: [] } 结构的对象,其中 cells 数组按渲染顺序保存节点和边。
其中,导出的节点结构如下:
{

  id: string,

  shape: string,

  position: {

    x: number

    y: number

  },

  size: {

    width: number

    height: number

  },

  attrs: object,

  zIndex: number,

}
边的结构如下:
{

  id: string,

  shape: string,

  source: object,

  target: object,

  attrs: object,

  zIndex: number,

}
7.2 导入
支持节点/边元数据数组 graph.fromJSON(cells: (Node.Metadata | Edge.Metadata)[])。
graph.fromJSON([

  {

    id: "node1",

    x: 40,

    y: 40,

    width: 100,

    height: 40,

    label: "Hello",

    shape: "rect",

  },

  {

    id: "node2",

    x: 40,

    y: 40,

    width: 100,

    height: 40,

    label: "Hello",

    shape: "ellipse",

  },

  {

    id: "edge1",

    source: "node1",

    target: "node2",

    shape: "edge",

  },

]);
或者提供一个包含 cells、nodes、edges 的对象,按照 [...cells, ...nodes, ...edges] 顺序渲染。
graph.fromJSON({

  nodes: [],

  edges: [],

});
通常,我们通过 graph.fromJSON(...) 来渲染 graph.toJSON() 导出的数据。
标签:node,速通,graph,AntV,40,cell,edge,X6,节点 From: https://blog.csdn.net/weixin_64684095/article/details/140258009