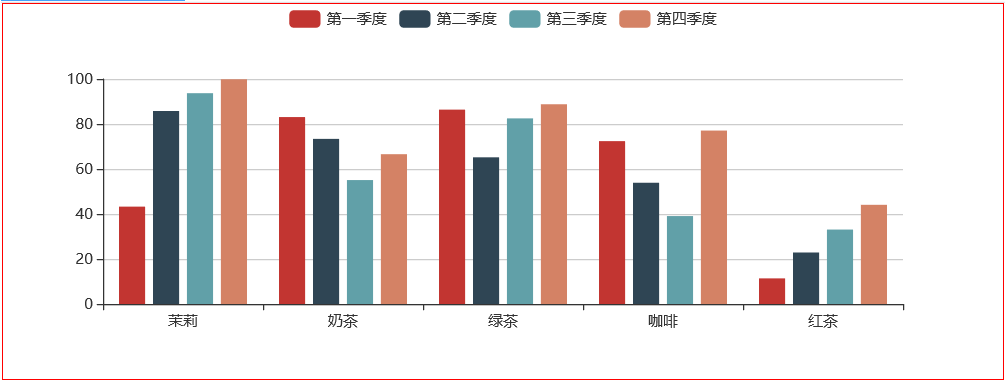
Echarts快速使用

<!DOCTYPE html>
<html style="height: 100%">
   <head>
       <meta charset="utf-8">
       <script type="text/javascript" src="js/echarts.min.js" ></script>
       <script type="text/javascript">
               	function showData(){
               		var dom = document.getElementById("container");
                                var myChart = echarts.init(dom);
                                var app = {};
                                option = null;
                                option = {
                                    legend: {},
                                    tooltip: {},
                                    dataset: {
                                        source: [
                                            ['product', '第一季度', '第二季度', '第三季度','第四季度'],
                                            ['茉莉', 43.3, 85.8, 93.7,99.9],
                                            ['奶茶', 83.1, 73.4, 55.1,66.6],
                                            ['绿茶', 86.4, 65.2, 82.5,88.8],
                                            ['咖啡', 72.4, 53.9, 39.1,77.1],
                                            ['红茶', 11.4, 22.9, 33.1,44.1]
                                        ]
                                    },
                                    xAxis: {type: 'category'},
                                    yAxis: {},
                                    // Declare several bar series, each will be mapped
                                    // to a column of dataset.source by default.
                                    series: [
                                        {type: 'bar'},
                                        {type: 'bar'},
                                        {type: 'bar'},
                                        {type: 'bar'}
                                    ]
                                };
                                ;
                                if (option && typeof option === "object") {
                                    myChart.setOption(option, true);
                                }
               	}
       </script>
   </head>
   <body style="height: 100%; margin: 0">
       <div id="container" style="height: 300px;width: 800px;border: 1px solid red; margin: 0px auto;"></div>


       <input type="button" value="显示数据" onclick="showData()" />
   </body>
</html>
标签:8.2,bar,option,展示,dataset,var,type,echarts From: https://www.cnblogs.com/2324hh/p/17024062.html