
matplotlib.pyplot 模块提供了 subplot2grid() ,该函数能够在画布的特定位置创建 axes 对象(即绘图区域)。不仅如此,它还可以使用不同数量的行、列来创建跨度不同的绘图区域。与 subplot() 和 subplots() 函数不同,subplot2gird() 函数以非等分的形式对画布进行切分,并按照绘图区域的大小来展示最终绘图结果。
函数语法格式如下:
plt.subplot2grid(shape, location, rowspan, colspan)
参数含义如下:
- shape:把该参数值规定的网格区域作为绘图区域;
- location:在给定的位置绘制图形,初始位置 (0,0) 表示第1行第1列;
- rowsapan/colspan:这两个参数用来设置让子区跨越几行几列。
下面,在画布(figure)中添加了行、列跨度均不相同的绘图子区域,然后在每个绘图区上,绘制不同的图形。示例代码如下:
- import matplotlib.pyplot as plt
- #使用 colspan指定列,使用rowspan指定行
- a1 = plt.subplot2grid((3,3),(0,0),colspan = 2)
- a2 = plt.subplot2grid((3,3),(0,2), rowspan = 3)
- a3 = plt.subplot2grid((3,3),(1,0),rowspan = 2, colspan = 2)
- import numpy as np
- x = np.arange(1,10)
- a2.plot(x, x*x)
- a2.set_title('square')
- a1.plot(x, np.exp(x))
- a1.set_title('exp')
- a3.plot(x, np.log(x))
- a3.set_title('log')
- plt.tight_layout()
- plt.show()
输出结果如下:
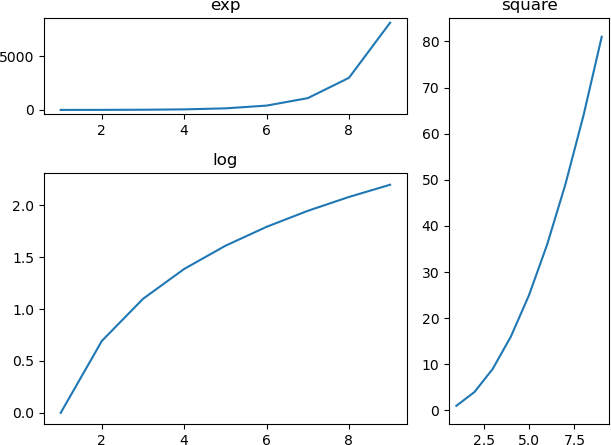
图1:subplot2grid()输出结果 标签:11,plt,subplot2grid,colspan,Matplotlib,rowspan,绘图,np From: https://www.cnblogs.com/55zjc/p/16582037.html