原题链接在这里:https://leetcode.com/problems/maximum-number-of-intersections-on-the-chart/description/
题目:
There is a line chart consisting of n points connected by line segments. You are given a 1-indexed integer array y. The kth point has coordinates (k, y[k]). There are no horizontal lines; that is, no two consecutive points have the same y-coordinate.
We can draw an infinitely long horizontal line. Return the maximum number of points of intersection of the line with the chart.
Example 1:
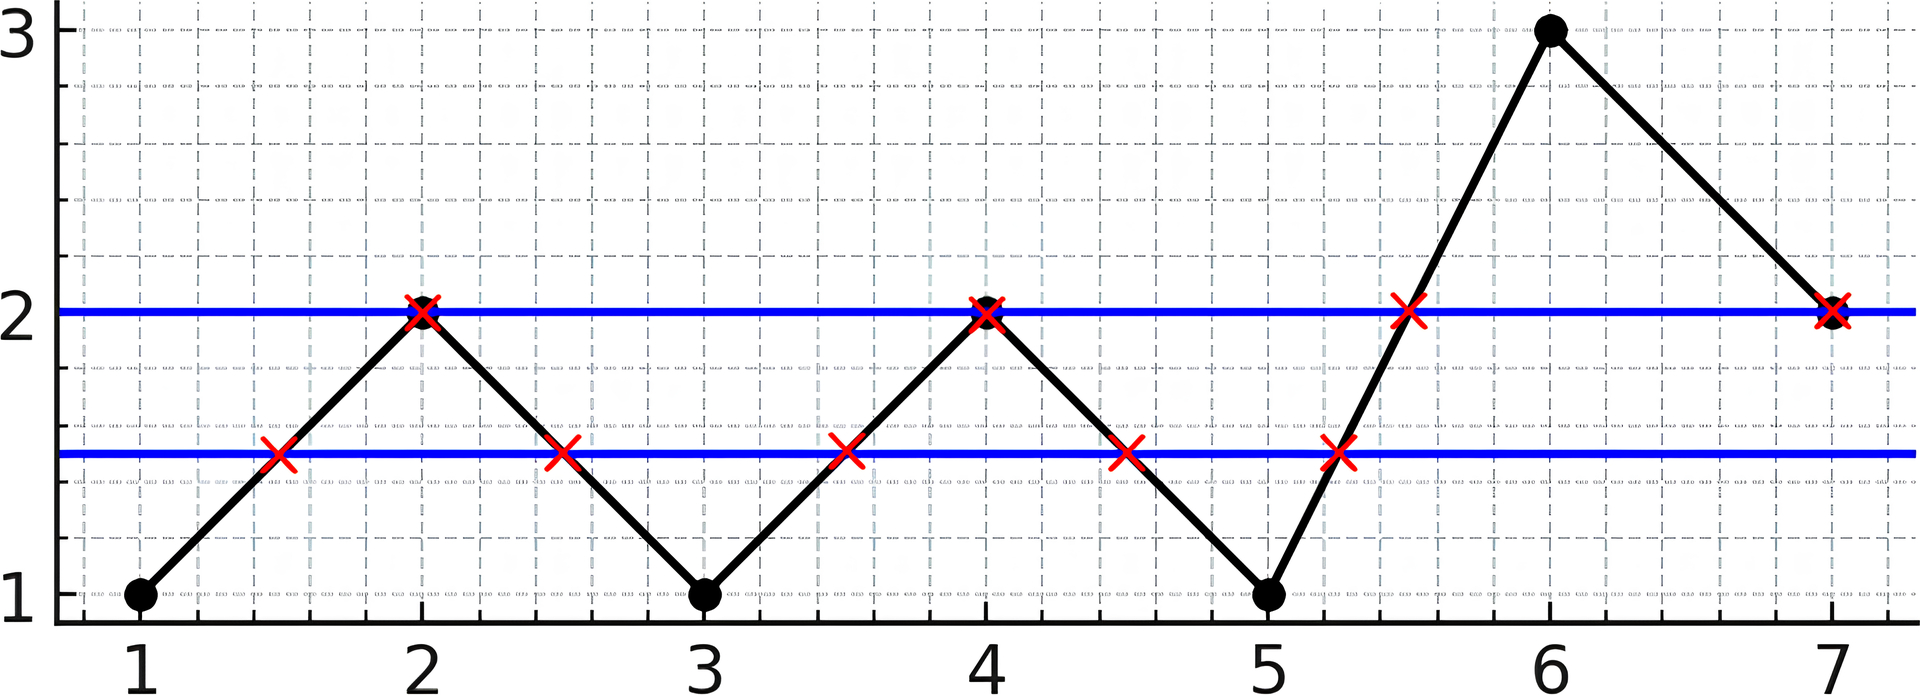
Input: y = [1,2,1,2,1,3,2]
Output: 5
Explanation: As you can see in the image above, the line y = 1.5 has 5 intersections with the chart (in red crosses). You can also see the line y = 2 which intersects the chart in 4 points (in red crosses). It can be shown that there is no horizontal line intersecting the chart at more than 5 points. So the answer would be 5.
Example 2:
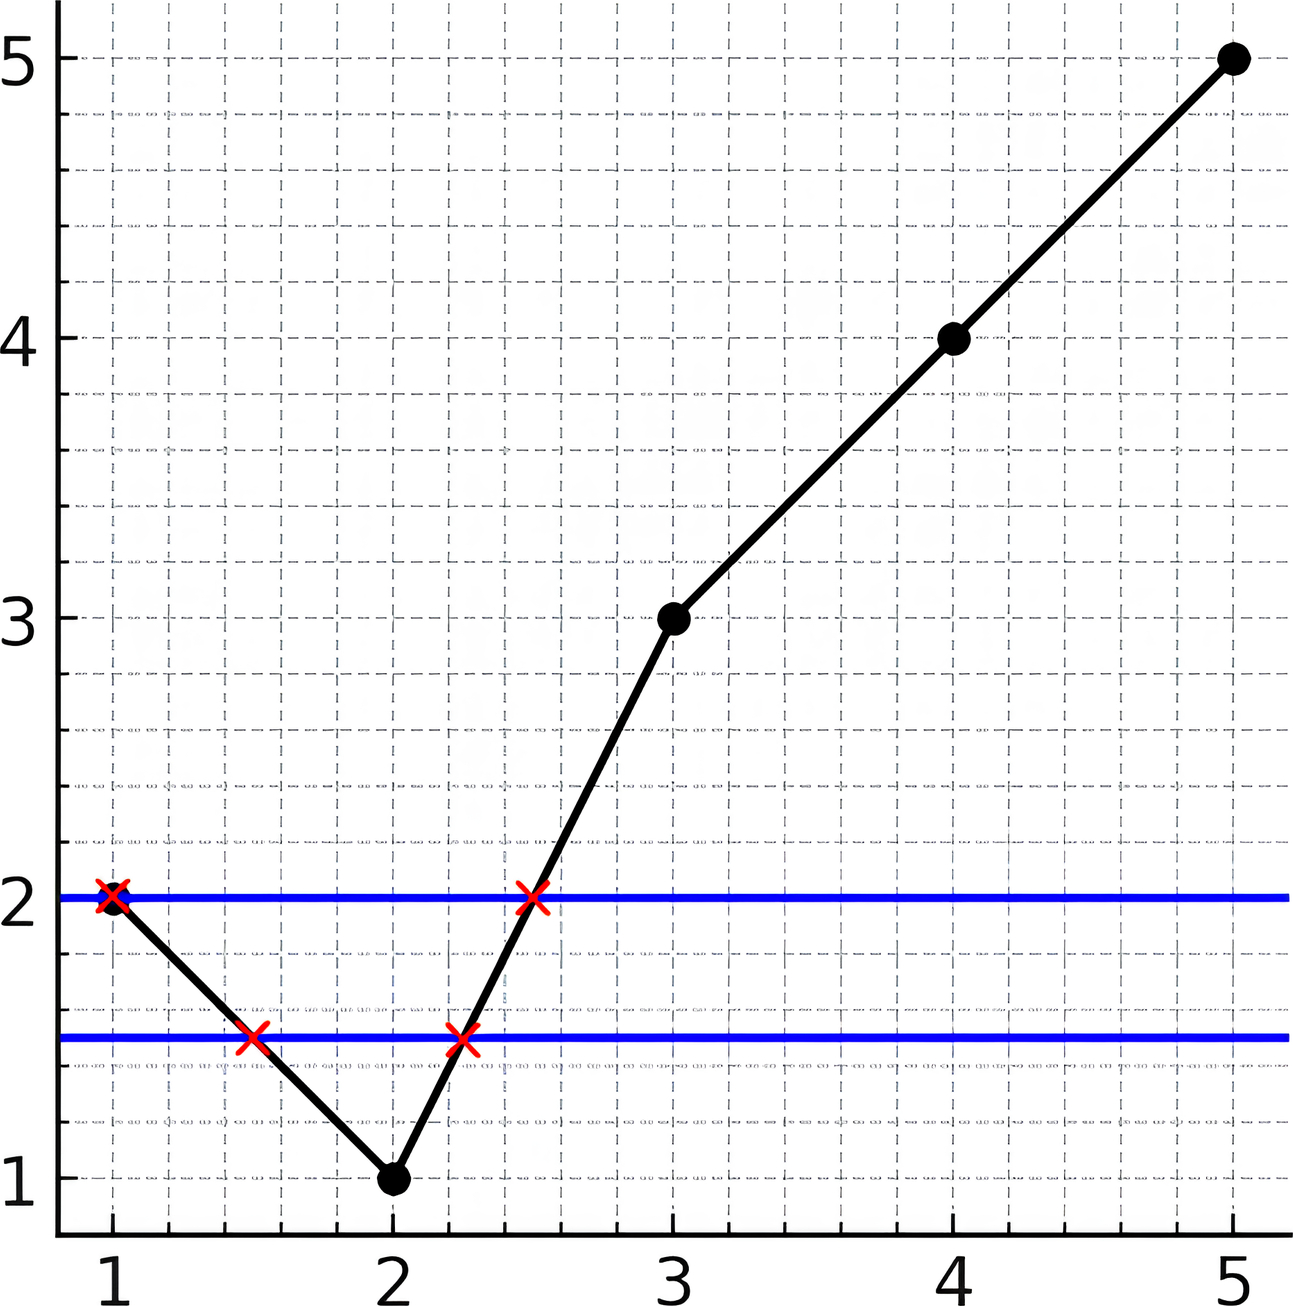
Input: y = [2,1,3,4,5]
Output: 2
Explanation: As you can see in the image above, the line y = 1.5 has 2 intersections with the chart (in red crosses). You can also see the line y = 2 which intersects the chart in 2 points (in red crosses). It can be shown that there is no horizontal line intersecting the chart at more than 2 points. So the answer would be 2.
Constraints:
2 <= y.length <= 1051 <= y[i] <= 109y[i] != y[i + 1]foriin range[1, n - 1]
题解:
It is to find out on the y axis, what is the maximum overlap intervals count.
Then use sweep line, at the start of interval, increase the count, after the end of interval, decrease the count.
And make the maximum.
Chanllenging point is how to avoid double count of inclusive endpoint. like [1, 2], [2, 0]. 2 is counted as twice.
So double the endpoint value and use +1, -1 to make them exclusive with each other, then above becomes [2, 3], [4, 1].
The last interval, we don't need to +1, or -1, there is no following overlapping.
Time Complexity: O(nlogn). n = y.length.
Space: O(n).
AC Java:
 1 class Solution {
 2     public int maxIntersectionCount(int[] y) {
 3         TreeMap<Integer, Integer> tm = new TreeMap<>();
 4         int n = y.length;
 5         for(int i = 1; i < n; i++){
 6             int s = 2 * y[i - 1];
 7             int e = 2 * y[i] + (i == n - 1 ? 0 : (y[i - 1] < y[i] ? -1 : 1));
 8
 9             int min = Math.min(s, e);
10             int max = Math.max(s, e);
11             tm.put(min, tm.getOrDefault(min, 0) + 1);
12             tm.put(max + 1, tm.getOrDefault(max + 1, 0) - 1); // sweep line, after the max the count needs to decrease by 1
13         }
14
15         int res = 0;
16         int count = 0;
17         for(int v : tm.values()){
18             count += v;
19             res = Math.max(res, count);
20         }
21
22         return res;
23     }
24 }
标签:count,tm,int,chart,Chart,points,Number,line,Intersections From: https://www.cnblogs.com/Dylan-Java-NYC/p/18188575