matplotlib条形图
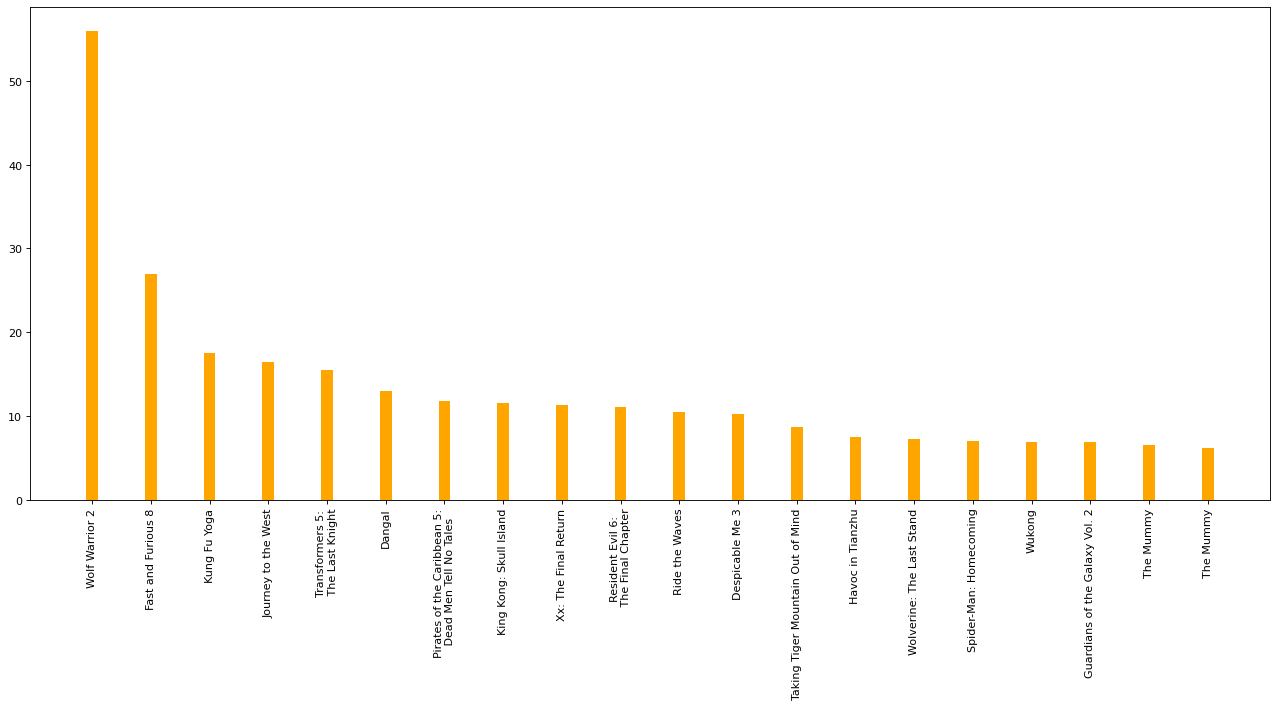
假设你获取到了2017年内地电影票房前20的电影(列表a)和电影票房数据(列表b), 那么如何更加直观的展示该数据?
from matplotlib import pyplot as plt

a = ["Wolf Warrior 2", "Fast and Furious 8", "Kung Fu Yoga", "Journey to the West", "Transformers 5:\n The Last Knight", "Dangal", "Pirates of the Caribbean 5:\n Dead Men Tell No Tales", "King Kong: Skull Island", "Xx: The Final Return", "Resident Evil 6:\n The Final Chapter", "Ride the Waves", "Despicable Me 3", "Taking Tiger Mountain Out of Mind", "Havoc in Tianzhu","Wolverine: The Last Stand", "Spider-Man: Homecoming", "Wukong", "Guardians of the Galaxy Vol. 2", "The Mummy", "The Mummy"]
b = [56.01,26.94,17.53,16.49,15.45,12.96,11.8,11.61,11.28,11.12,10.49,10.3,8.75,7.55,7.32,6.99,6.88,6.86,6.58,6.23]

# 设置图形大小
plt.figure(figsize=(20, 8), dpi=80)
# 绘制条形图
plt.bar(range(len(a)), b, width=0.2, color="orange")
# 设置x轴刻度
plt.xticks(range(len(a)), a, rotation=90)
plt.show()
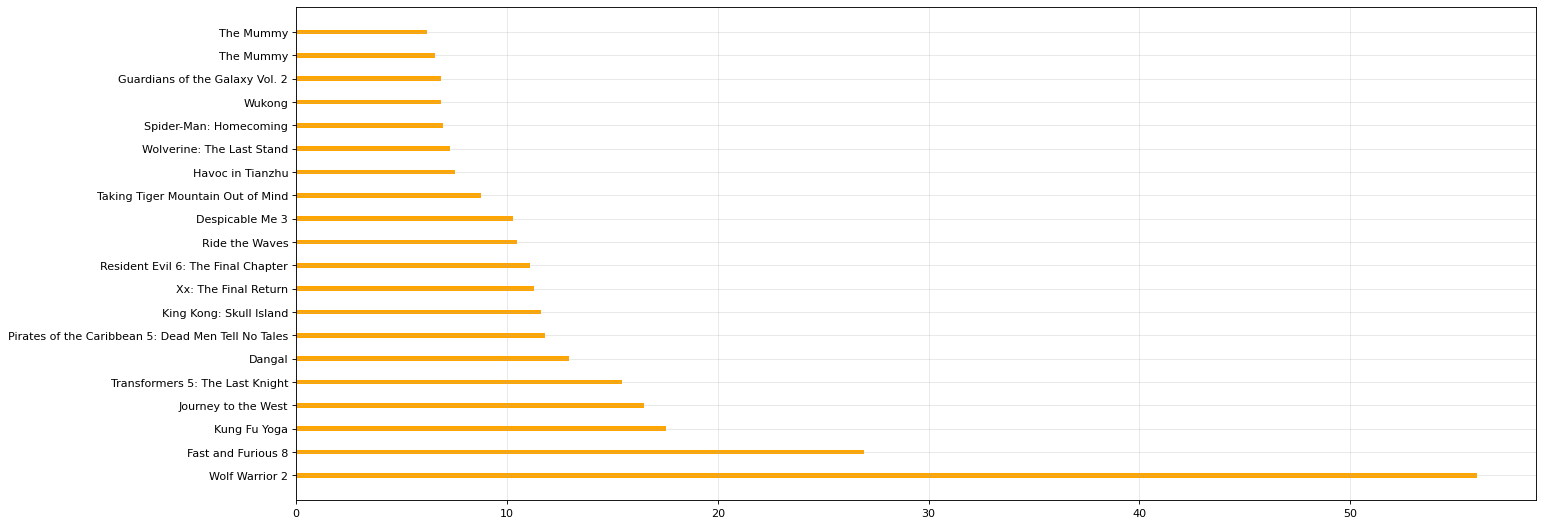
# 绘制横着的条形图, 能更清楚的表示
a = ["Wolf Warrior 2", "Fast and Furious 8", "Kung Fu Yoga", "Journey to the West", "Transformers 5: The Last Knight", "Dangal", "Pirates of the Caribbean 5: Dead Men Tell No Tales", "King Kong: Skull Island", "Xx: The Final Return", "Resident Evil 6: The Final Chapter", "Ride the Waves", "Despicable Me 3", "Taking Tiger Mountain Out of Mind", "Havoc in Tianzhu","Wolverine: The Last Stand", "Spider-Man: Homecoming", "Wukong", "Guardians of the Galaxy Vol. 2", "The Mummy", "The Mummy"]
b = [56.01,26.94,17.53,16.49,15.45,12.96,11.8,11.61,11.28,11.12,10.49,10.3,8.75,7.55,7.32,6.99,6.88,6.86,6.58,6.23]

# 设置图形大小
plt.figure(figsize=(20, 8), dpi=80)
# 绘制横着的条形图, 参数由宽度变为高度
plt.barh(range(len(a)), b, height=0.2, color="orange")
# 设置y轴刻度, 且不需要旋转
plt.yticks(range(len(a)), a)
# 设置网格
plt.grid(alpha=0.3)
plt.show()
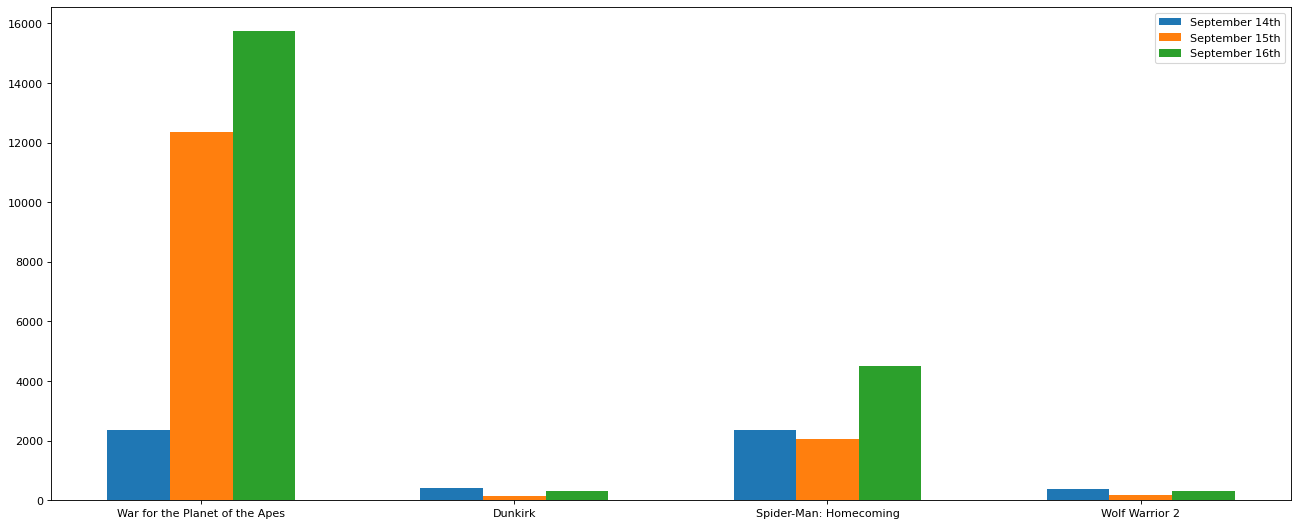
假设你知道了列表a中电影分别在2017-09-14(b_14), 2017-09-15(b_15), 2017-09-16(b_16)三天的票房, 为了展示列表中电影本身的票房以及同其他电影的数据对比情况, 应该如何更加直观的呈现该数据?
x = ["War for the Planet of the Apes", "Dunkirk", "Spider-Man: Homecoming", "Wolf Warrior 2"]
# b_i表示这四部电影在第i天的票房
b_14 = [2358,399,2358,362]
b_15 = [12357,156,2045,168]
b_16 = [15746,312,4497,319]

# 设置条形的宽度
bar_width = 0.2

x_14 = list(range(len(x)))
x_15 = [i+bar_width for i in x_14]
x_16 = [i+bar_width*2 for i in x_14]
print("x_14:", x_14)
print("x_15:", x_15)
print("x_16:", x_16)

plt.figure(figsize=(20, 8), dpi=80)
plt.bar(x_14, b_14, width=bar_width, label="September 14th")
plt.bar(x_15, b_15, width=bar_width, label="September 15th")
plt.bar(x_16, b_16, width=bar_width, label="September 16th")

# 添加x轴刻度
plt.xticks(x_15, x)
# 添加图例
plt.legend(loc="best")
plt.show()
x_14: [0, 1, 2, 3]
x_15: [0.2, 1.2, 2.2, 3.2]
x_16: [0.4, 1.4, 2.4, 3.4]