本文通过结合如下论文以及blog:
1、贝叶斯优化研究综述:https://doi.org/10.13328/j.cnki.jos.005607.
2、高斯回归可视化:https://jgoertler.com/visual-exploration-gaussian-processes/
3、贝叶斯优化:http://arxiv.org/abs/1012.2599
对贝叶斯优化进行较为全面的介绍,以及部分代码复现
贝叶斯优化
目录介绍
问题一:如果存在函数\(y=x^2\)那么对于这个函数很容易就可以得到他的最小值\(x=0\)时取到最小值,但是如果只告诉我们存在函数\(y=f(x)\)(\(f(x)\)具体的表达式未知),我们如何找到他的最小值呢?
问题二:对于机器学习、深度学习模型都是由许多参数所决定的(比如说:深度学习中学习率、网络深度等),假如我们通过计算模型的\(R^2\)来选择我们的参数,那么如何选择参数的值使得\(R^2\)最大呢?
Grid Search?Random Search?Bayesian optimization?
超参数优化
百度百科:
https://baike.baidu.com/item/超参数/3101858
Wiki:
本文主要对Bayesian optimization进行解释。贝叶斯优化通过有限的步骤进行全局优化。定义我们的待优化函数:
\[x^{*}=\underset{x\in X}{argmin}f(x) \]上式子中:\(x\)代表决策向量(直观理解为:深度学习中的学习率、网络深度等),\(X\)代表决策空间(直观理解为:以学习率为例,假设我们能从学习率集合\(\alpha=(0.01,0.02,0.03)\)[<--这就是决策空间] 选择最佳学习率[<--这就是我们决策向量],\(f\)则代表目标函数(比如上面提到的\(R^2\)或者机器学习模型\(f\)))
许多机器学习中的优化问题都是黑盒优化问题,我们函数是一个黑盒函数[1]。如何通过贝叶斯优化实现(1)式子呢?贝叶斯优化的两板斧:(1)surrogate model(代理模型);(2)acquisition function(采集函数)。贝叶斯优化框架如下[2]:

贝叶斯优化框架应用在一维函数\(f(x)=(x-0.3)^2+0.2sin(20x)\)上3次迭代的示例:

一、代理模型(surrogate models)
1、高斯过程(GP)
上面提及到机器学习是一个黑盒子(black box),即我们只知道input和output,所以很难确直接定存在什么样的函数关系[3]。既然你的函数关系确定不了,那么我们就可以直接找到一个模型对你的函数进行替代(代理),这就是贝叶斯优化第一板斧:代理模型。(使用概率模型代理原始评估代价高昂的复杂目标函数)
这里主要解释高斯过程(Gaussian processes,GP)[4]
其他代理模型,感兴趣的可以阅读这篇论文
WiKi:
高斯过程 - 维基百科,自由的百科全书 (wikipedia.org)
百度百科:
高斯过程:就是一系列关于连续域(时间或空间)的随机变量的联合,而且针对每一个时间或是空间点上的随机变量都是服从高斯分布的
解释高斯过程前了解高斯分布学过概率论的应该都了解,高斯分布其实就是正态分布平时所学的大多为一元正态分布,推广到\(n\)维的高斯分布:
\[X=\begin{bmatrix}X_1\\X_2\\...\\X_n\end{bmatrix}∼N(\mu,\sum) \]其中\(\mu\)代表均值,\(\sum\)代表协方差。
高斯过程的数学原理[5]:
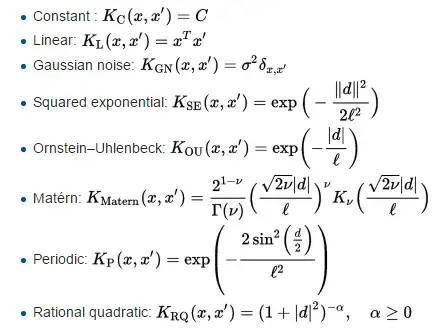
\[f(x)∼GP(m(x),k(x,x^{'})) \]其中\(m(x)\)代表均值(为了方便令\(m(x)=0\)),\(k\)代表核函数。常用核函数:
\[k(x_i,x_j)=\sum=cov(x_i,x_j)=exp(-\frac{1}{2}||x_i-x_j||^2) \]其他核函数

在高斯过程中,核函数往往就决定了分布的形状,于此同时也就决定我们需要预测函数所具有的特性,对于不同两点\(x_i\)和\(x_j\)两点距离近则值接近1反之则接近0。那么可以得到核矩阵为:
\[K=\begin{bmatrix}k(x_1,x_1)&...&k(x_1,x_t)\\...&...&...\\k(x_t,x_1)&...&k(x_1,x_t) \end{bmatrix} \]以回归任务为例[4:1],高斯过程定义了潜在函数的概率分布,由于这是一个多元高斯分布,这些函数也呈正态分布。通常假设\(μ= 0\),在没有观察到任何训练数据的情况下。在贝叶斯推断的框架下,将其称之为先验分布 \(f(x)∼N(\mu_f,K_f)\)。在没观察到任何训练样本,该分布会围绕 \(μ_f=0\)展开(可定义此时先验分布为\(f(x)∼N(0,K_f)\))。先验分布的维数和测试点的数目 \(N=∣X∣\)一致。我们将用核函数来建立协方差矩阵,维数为\(N×N\)。

以RBF为核函数生成5组样本
当补充训练样本时得到:

输入样本点,数学原理如下:假设观察到样本点为\((x,y)\)那么\(y\)与先验分布\(f(x)\)的联合高斯分布为:
\[\begin{bmatrix}f(x)\\y \end{bmatrix}∼N(\begin{bmatrix}0\\0 \end{bmatrix},\begin{bmatrix}K_{ff}&&K_{fy}\\K^{T}_{fy}&&K_{yy} \end{bmatrix}) \]那么此时可以根据联合分布得到\(P(y|f)\)的分布为:
\[P(y|f)=N(\mu(x),\sigma^2(x)) \]其中:\(\mu(x)=K^{T}_{fy}K_{ff}^{-1}f(x)\),\(\sigma^2(x)=K_{yy}-K^{T}_{fy}K_{ff}^{-1}K_{fy}\)
从回归的角度对高斯过程进行理解:假设我们需要拟合函数为:
\[y=sin(2.5x)+sin(x)+0.05x^2+1 \]我们通过设置\(x\)范围生成输入数据,那么可以得到输出数据\(y\)那么GP拟合如下:

上图也很容易理解,在\(x<10\)以前我们输入了数据那么置信区间范围较小,而\(x>10\)之后由于没有输入数据置信区间范围较大

具有三个观测值的简单一维高斯过程。实线黑线是给定数据的目标函数的GP代理均值预测,阴影区域表示均值加减方差。
Simple 1D Gaussian process with three observations. The solid black line is the GP surrogate mean prediction of the objective function given the data, and the shaded area shows the mean plus and minus the variance. The superimposed Gaussians correspond to the GP mean and standard deviation ($μ(·) $and $σ(·)) $of prediction at the points, \(x_{1:3}\).
2、TPE
高斯过程中通过\(p(y|x)\)
二、采集函数(Acquisition Functions)
在论文中作者对于采集函数的描述为:
The role of the acquisition function is to guide the search for the optimum.
个人理解为:上一节介绍了GP过程中引入新的数据点其联合分布,那么的话我们可以直接引入\(n\)个点直接将全部\(x\)进行覆盖,但是这样的话Bayesian optimization就失去其意义了,如何通过最少的点去实现\(x^{*}=\underset{x\in X}{argmin}f(x)\)
Acquisition functions are defined such that high acquisition corresponds to potentially high values of the objective function.
采集函数被定义为目标函数的潜在高值
可以对采集函数理解为:去找到一个合适的点。常用的采集函数:
1、probability of improvement(PI)
PI去尝试最大化现有的概率\(f(x^+)\),其中\(x^+=\underset{x\in X}{argmax}f(x)\)其公式为:
\[PI_{t}(x)=P(f_{t}(x) \geq f_{t}(x^+)+\xi)=\phi(\frac{\mu_{t}(x)-f_{t}(x^+)-\xi}{\sigma_{t}(x)}) \]其中\(\phi(.)\)为正则化,\(\xi(\xi \geq 0)\)为权重。PI策略通过PI提升最大化来选择新一轮的超参组合:
\[x_{t+1}=argmax_{x}(PI_{t}(x)) \]其中\(x_{t+1}\)代表新一轮超参组合。
2、expected improvement(EI)
PI策略选择提升概率最大的候选点,这一策略值考虑了提升的概率而没有考虑提升量的大小,EI针对此提出:\(EI(x)=E[max(f_{t+1}(x)-f(x^+),0)]\)那么EI函数为:
\[f(n)= \begin{cases} (\mu(x)-f(x^+)\phi(Z)+\sigma(x)\phi(Z) & \text {if $\phi(x)>0$} \\ 0 & \text{if $\phi(x)=0$ } \end{cases} \]其中\(Z=\frac{\mu(x)-f(x^+)}{\sigma(x)}\)
具体公式推导见论文(第13页):http://arxiv.org/abs/1012.2599
3、Confidence bound criteria(置信边界策略)
1. LCB(置信下界策略,计算目标函数最小值)
\[LCB(x)=\mu(x)-\kappa \phi(x) \]2. UCB(置信上界策略,计算目标函数最大值)
\[UCB(x)=\mu(x)+\kappa \phi(x) \]LCB、UCB中的\(\kappa\) is left to the user
3. GP-UCB
\[GP-UCB=\mu(x)+\sqrt{v\tau_{t}}\phi(x) \]GP-UCB很简单的一种采集策略,以随机变量的置信上界最大化为原则选择下一轮的超参组合
4.其它
见论文:https://doi.org/10.13328/j.cnki.jos.005607
总结
1、常用代理函数

2、常用采集函数

代码
代码参考:https://github.com/bayesian-optimization/BayesianOptimization
from bayes_opt import BayesianOptimization #调用第三方库
from skelarn.svm import SVR
from sklearn.metrics import r2_score

#交叉验证贝叶斯优化
X_train, X_test, Y_train, Y_test= train_test_split(x,y,test_size=0.2,random_state=100)
from sklearn.svm import SVR
def svr_cv(C, epsilon, gamma):
    kf = KFold(n_splits=5, shuffle=True, random_state=100)
    svr = SVR(C=C, epsilon=epsilon, gamma=gamma)
    for i, (train_index, test_index) in enumerate(kf.split(X_train, Y_train.values)):
        svr.fit(X_train[train_index], Y_train.values[train_index])
        pred = svr.predict(X_train[test_index])
        return r2_score(pred, Y_train.values[test_index])

svr_bo = BayesianOptimization(svr_cv,{'C':(1,16), 'epsilon':(0,1), 'gamma':(0,1)})
#输入测试的函数,以及变量的范围
svr_bo.maximize()

svr_bo.max #得到最佳参数
#{'target': 0.9875895309185105,
# 'params': {'C': 14.595794386042416,
#  'epsilon': 0.09480102745231553,
#  'gamma': 0.09251046201638335}}
通过最佳参数进行测试:
svr1 =  SVR(C=14.595794386042416, epsilon=0.09480102745231553, gamma=0.09251046201638335)
svr1.fit(X_train, Y_train)
r2_score(Y_test.values, svr1.predict(X_test))
#0.9945825852230629
高斯拟合代码:
n = 100
x_min = -10
x_max = 10
X = np.sort(np.random.uniform(size=n))*(x_max- x_min) + x_min
X = X.reshape(-1, 1)
eta = np.random.normal(loc=0.0, scale= 0.5, size= n)

y_clean = np.sin(X * 2.5) + np.sin(X * 1.0)  + np.multiply(X, X) * 0.05 + 1
y_clean = y_clean.ravel()
y = y_clean+ eta
from sklearn.gaussian_process import GaussianProcessRegressor
from sklearn.gaussian_process.kernels import RBF

kernel = RBF(
    length_scale=1,
    length_scale_bounds=(1e-2, 1e3))

gpr = GaussianProcessRegressor( kernel,
                               alpha=0.1,
                               n_restarts_optimizer=5,
                               normalize_y=True)
gpr.fit(X,y )
#print("LML:", gpr.log_marginal_likelihood())
#print(gpr.get_params())
x = np.linspace(x_min - 2.0, x_max + 7.5, n * 2).reshape(-1, 1)
y_pred, y_pred_std = gpr.predict(x, return_std=True)
import matplotlib.pyplot as plt
plt.figure(figsize=(15, 8))
plt.plot(x, y_pred,linewidth = 3, label="GP mean")
plt.plot(X, y_clean, linewidth = 3,  label="Original y")
plt.plot(X, y,linewidth = 3, label="Noisy y")
plt.scatter(X, np.zeros_like(X), marker='x')
plt.fill_between(x.ravel(),
                 y_pred - y_pred_std,
                 y_pred + y_pred_std,
                label="95% confidence interval",
                interpolate=True,
                facecolor='blue',
                alpha=0.5)
plt.xlim(5, 15)
plt.legend()
推荐
1、Gaussian Processes for Machine Learning:https://gaussianprocess.org/gpml/chapters/RW.pdf
2、贝叶斯优化论文:http://arxiv.org/abs/1012.2599
3、贝叶斯优化博客:https://banxian-w.com/article/2023/3/27/2539.html
4、可视化高斯过程:https://jgoertler.com/visual-exploration-gaussian-processes/#MargCond
参考
1、http://krasserm.github.io/2018/03/21/bayesian-optimization/
2、https://zhuanlan.zhihu.com/p/53826787
3、崔佳旭, 杨博. 贝叶斯优化方法和应用综述[J/OL]. 软件学报, 2018, 29(10): 3068-3090. https://doi.org/10.13328/j.cnki.jos.005607.
4、https://jgoertler.com/visual-exploration-gaussian-processes/
5、http://arxiv.org/abs/1012.2599
6、https://www.cvmart.net/community/detail/3502
7、https://gaussianprocess.org/gpml/chapters/RW.pdf