在之前的版本中,官方技术团队为DevExtreme图表引入了注释支持。在v20.1版本中,继续扩展了对Polar Chart(雷达图)注释的支持,现在可以根据需要应用文本、图像或自定义注释。创建注释后,可以将其附加到Polar Chart(雷达图)元素(例如一个序列点)或在特定坐标上显示它。
DevExtreme拥有高性能的HTML5 / JavaScript小部件集合,使您可以利用现代Web开发堆栈(包括React,Angular,ASP.NET Core,jQuery,Knockout等)构建交互式的Web应用程序,该套件附带功能齐全的数据网格、交互式图表小部件、数据编辑器等。
本文中描述的新功能可以在DevExtreme支持的所有平台上使用,包括Angular, Vue, React, jQuery,ASP. NET MVC和ASP. NET Core。
DevExpress技术交流群8:523159565 欢迎一起进群讨论
注释类型
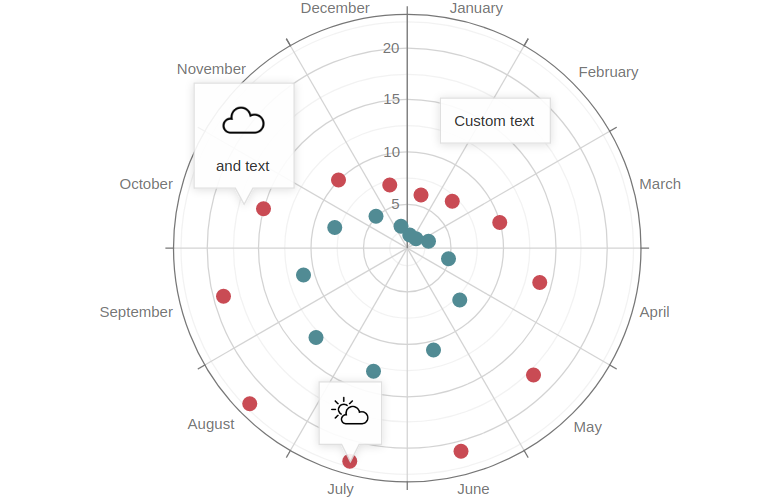
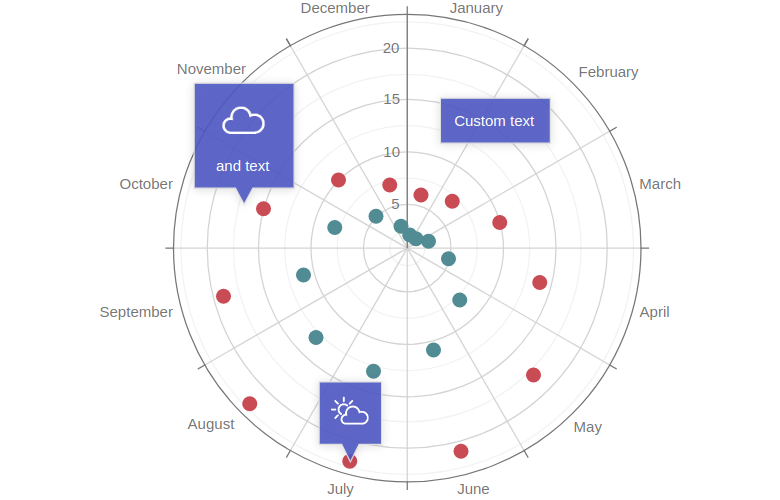
要在Polar Chart(雷达图)中显示注释,请使用新的“annotations”选项(接受一个表示单个注释的配置对象数组),每个对象都包含一个type属性。支持的注释类型包括' image ', ' text '和' custom ',根据所需的注释类型,您的配置对象必须指定' image ', ' text '或' template '。
下面的示例列出了所有支持的注释类型:
<dx-polar-chart>
…
<dxi-annotation
image="https://sun.png "
type="image"
argument="July"
series="Day">
</dxi-annotation>
<dxi-annotation
text="Custom text"
type="text"
[radius]="100"
[angle]="45">
</dxi-annotation>
<dxi-annotation
template="template"
type="custom"
argument="October"
[value]="17">
</dxi-annotation>
<svg *dxTemplate="let annotation of 'template'">
<image attr.href="https://cloud.png" width="60" height="40" />
<text x="8" y="60" >and text</text>
</svg>
</dx-polar-chart>
上述配置生成如下可视化:
注释的位置
用户可以将注释附加到Polar Chart(雷达图) UI元素上,也可以不将其固定在绝对坐标上,让我们回顾一下与位置相关的选择:
所属的注释
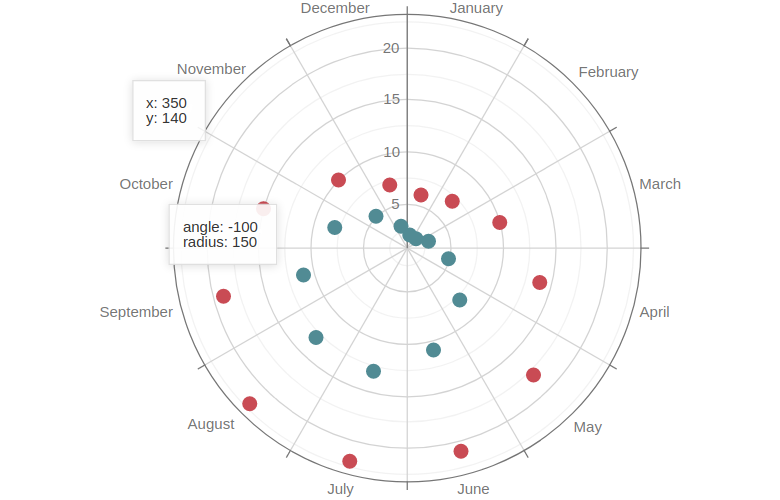
在下面的示例中,注释没有连接到任何Polar Chart(雷达图) UI元素,它们使用绝对坐标。
annotations: [{
x: 350,
y: 140
}, {
angle: -100,
radius: 150
}]
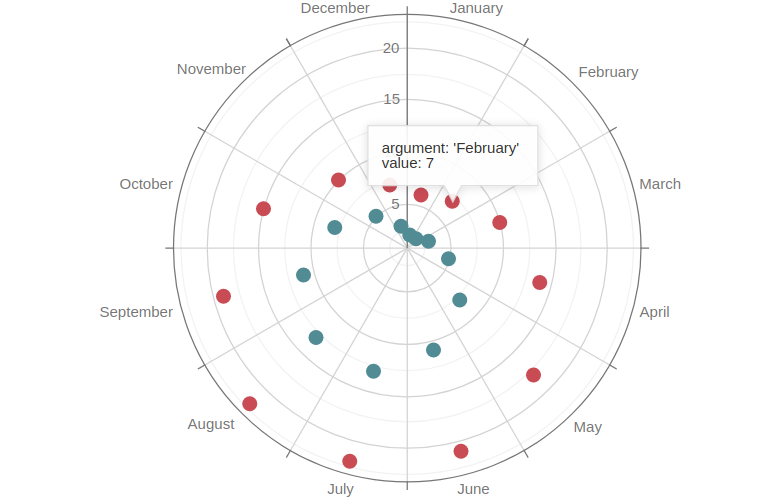
锚定在参数上的注释
annotations: [{
argument: "February",
value: 7
}]
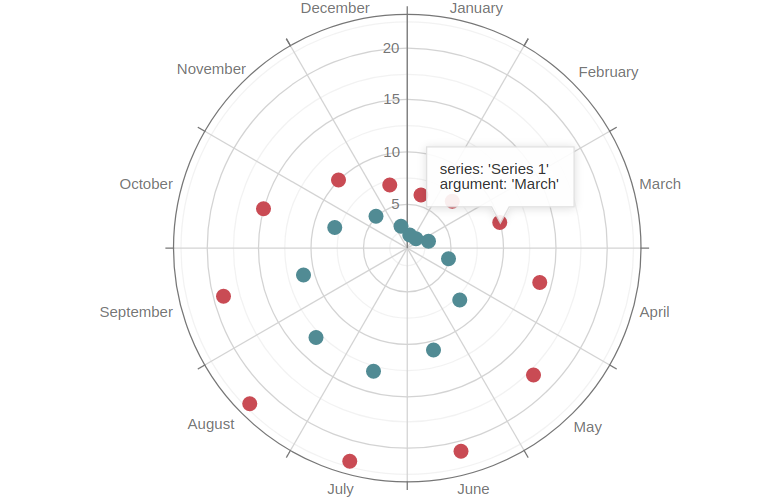
锚定在系列点上的注释
annotations: [{
argument: "March",
series: "Series 1"
}]
锚定在轴上的注释
annotations: [{
argument: "May"
}, {
value: 15
}]
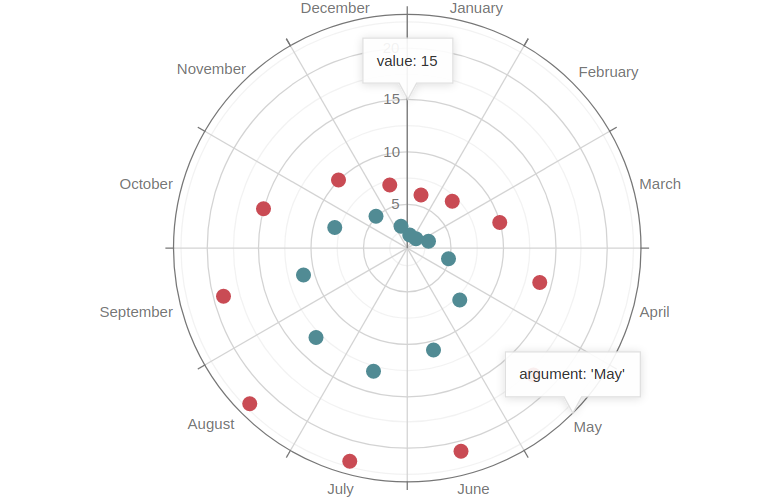
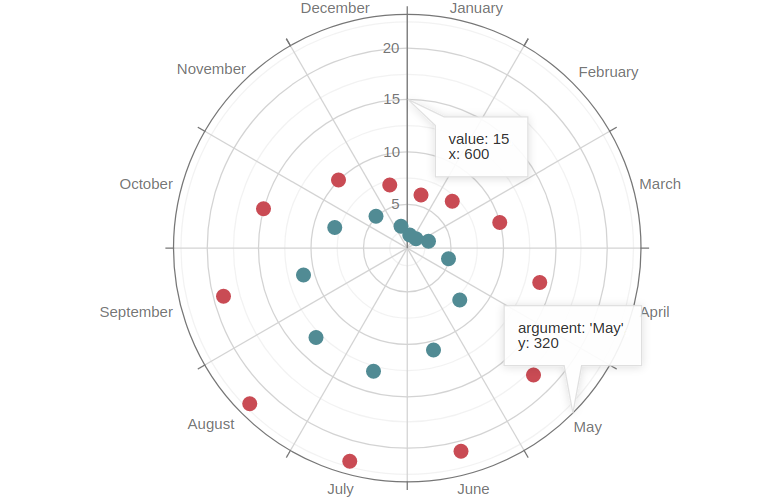
带有混合锚定的注解
在这个示例中,像素和图表坐标同时使用:
annotations: [{
argument: "May",
y: 320
}, {
value: 15,
x: 600
}]
常用注释设置
要为所有注释指定通用选项,使用'commonAnnotationsSettings '选项,下面的代码示例为Polar Chart(雷达图)上的所有注释应用背景和字体颜色(使用Angular标记):
<dx-common-annotation-settings color="#5258c7">
<dxo-font color="#ffffff"></dxo-font>
</dx-common-annotation-settings>
基于单个注释数据点的配置
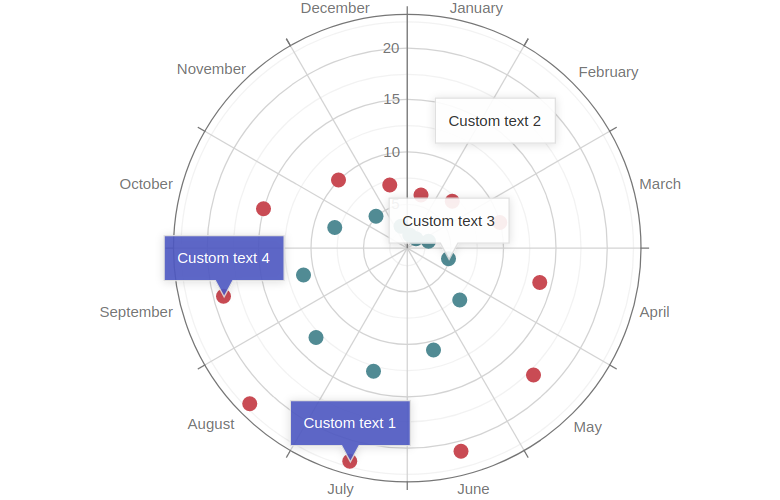
Polar Chart(雷达图)组件允许您通过' customizeAnnotation '回调函数定制单个注释,这可以帮助那些希望从远程数据服务获得注释数组的人。在下面的例子中,我们为属于“DayTemperature”系列的注释指定了一个背景颜色:
// app.component.html
<dx-polar-chart ...
customizeAnnotation: "customizeAnnotation">
<dxi-annotation ...
series="DayTemperature"
text="Custom text 1">
</dxi-annotation>
<dxi-annotation ...
text="Custom text 2">
</dxi-annotation>
<dxi-annotation ...
text="Custom text 3">
</dxi-annotation>
<dxi-annotation ...
series="DayTemperature"
text="Custom text 4">
</dxi-annotation>
</dx-polar-chart>

// app.component.ts
//...
export class AppComponent {
customizeAnnotation(item) {
if (item.series === "DayTemperature") {
item.color = "#5258c7";
item.font = {
color: "#ffffff"
};
}
return item;
}
}
更多DevExpress线上公开课、中文教程资讯请上中文网获取
标签:控件,Polar,Chart,注释,DevExtreme,雷达,使用指南,annotations From: https://www.cnblogs.com/AABBbaby/p/17407614.html