How to resolve "Cannot debug pid , NTSTATUS 0xC0000048" - "An attempt to set a process's DebugPort or ExceptionPort was made ..."
Once I found out what was causing this error message it was pretty obvious what was going on.
But when investigating there was not much information to be found so I thought I’d share this with you.
The ones who are more seasoned debuggers may think that this is stating the obvious but we who are not there yet may be helped by this J
Basically I wanted to debug a running w3wp.exe process.
So I fired up WinDbg, hit F6 for attaching to a process and selected the w3wp.exe process and was presented with this:
Cannot debug pid <pid>, NTSTATUS 0xC0000048
"An attempt to set a process's DebugPort or ExceptionPort was made, but a port already exists in the process or an attempt to set a file's CompletionPort made,
but a port was already set in the file or an attempt to set an ALPC port's associated completion port was made, but it is already set.
So I went about to do some research but couldn’t find any clear cut cause for this.
I tried to run the debugger as administrator. I closed all my programs and then I rebooted my machine but nothing helped.
In the end I learned something new.
That was that even if you restart the machine when you have an active rule running in Debug Diag this rule will auto activate after the reboot even if you have not restarted the Debug Diag tool.
So once I found this and stopped the rule in Debug Diag I could successfully attach to my process.
无法抓DUMP, 报错"Could not attach to process XXXX, NTSTATUS 0xC0000048"
Problem Description
=================
We tried to use ADPlus to capture dump file. But the size of dump files are all under 20K.
We tried it many times.
Trouble Shoot
=================
I tried to use the “PsExec.exe –s –i –d cmd.exe” to initialize ADPLUS. No luck.
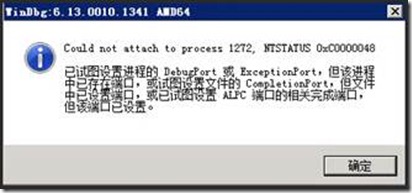
I tried to use WinDBG attach to the process, I failed with information below.
Detail Message is as below.
---------------------------
Could not attach to process 1272, NTSTATUS 0xC0000048
已试图设置进程的 DebugPort 或 ExceptionPort,但该进程中已存在端口,或试图设置文件的 CompletionPort,但文件中已设置端口,或已试图设置 ALPC 端口的相关完成端口,但该端口已设置。
Did more research, we found the root cause and solution.
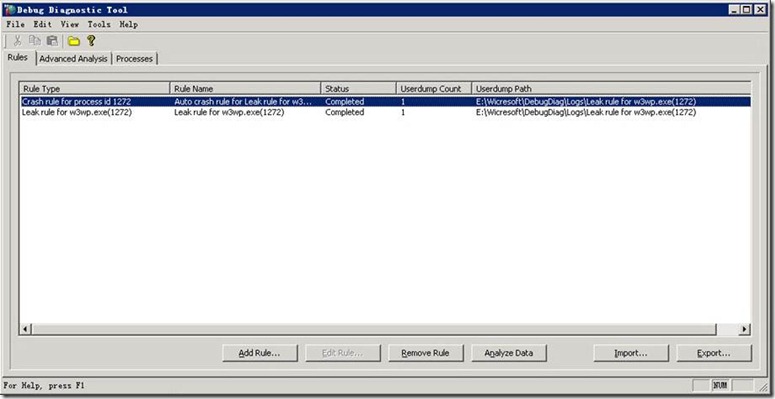
We saw DebugDiag, and we asked customer to open that. We see the dialog below.
There it is! 1272 is our SharePoint w3wp.exe process.
Root Cause
========================
Debug Diag already attached to the process.
Debug Diag has rules, which can attach to target process. Even if the rule is completed, it won’t let go of the process.
Another word to say is the debug port is still occurpied by DebugDiag, so other debuggers such as WinDBG or CDB.exe cannot attach and write dump file.
Solution
========================
1. Clear the Rules in DebugDiag.
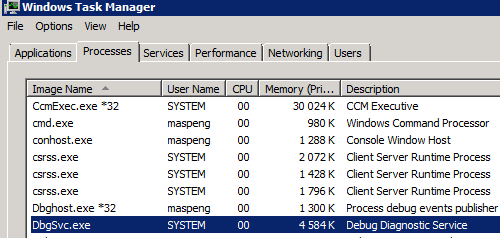
2. Kill the following processes in task manager.
· DbgSvc.exe
· Dbghost.exe
Problem Resolved.
Dump can now be successfully written.
Lesson Learned
========================
Be careful with DebugDiag. When its rules are finished, it won’t let go of the process.
标签:set,attempt,process,but,attach,exe,was From: https://www.cnblogs.com/ioriwellings/p/17134237.html


