标签:false show data 进度条 柱状图 series bar type Echarts
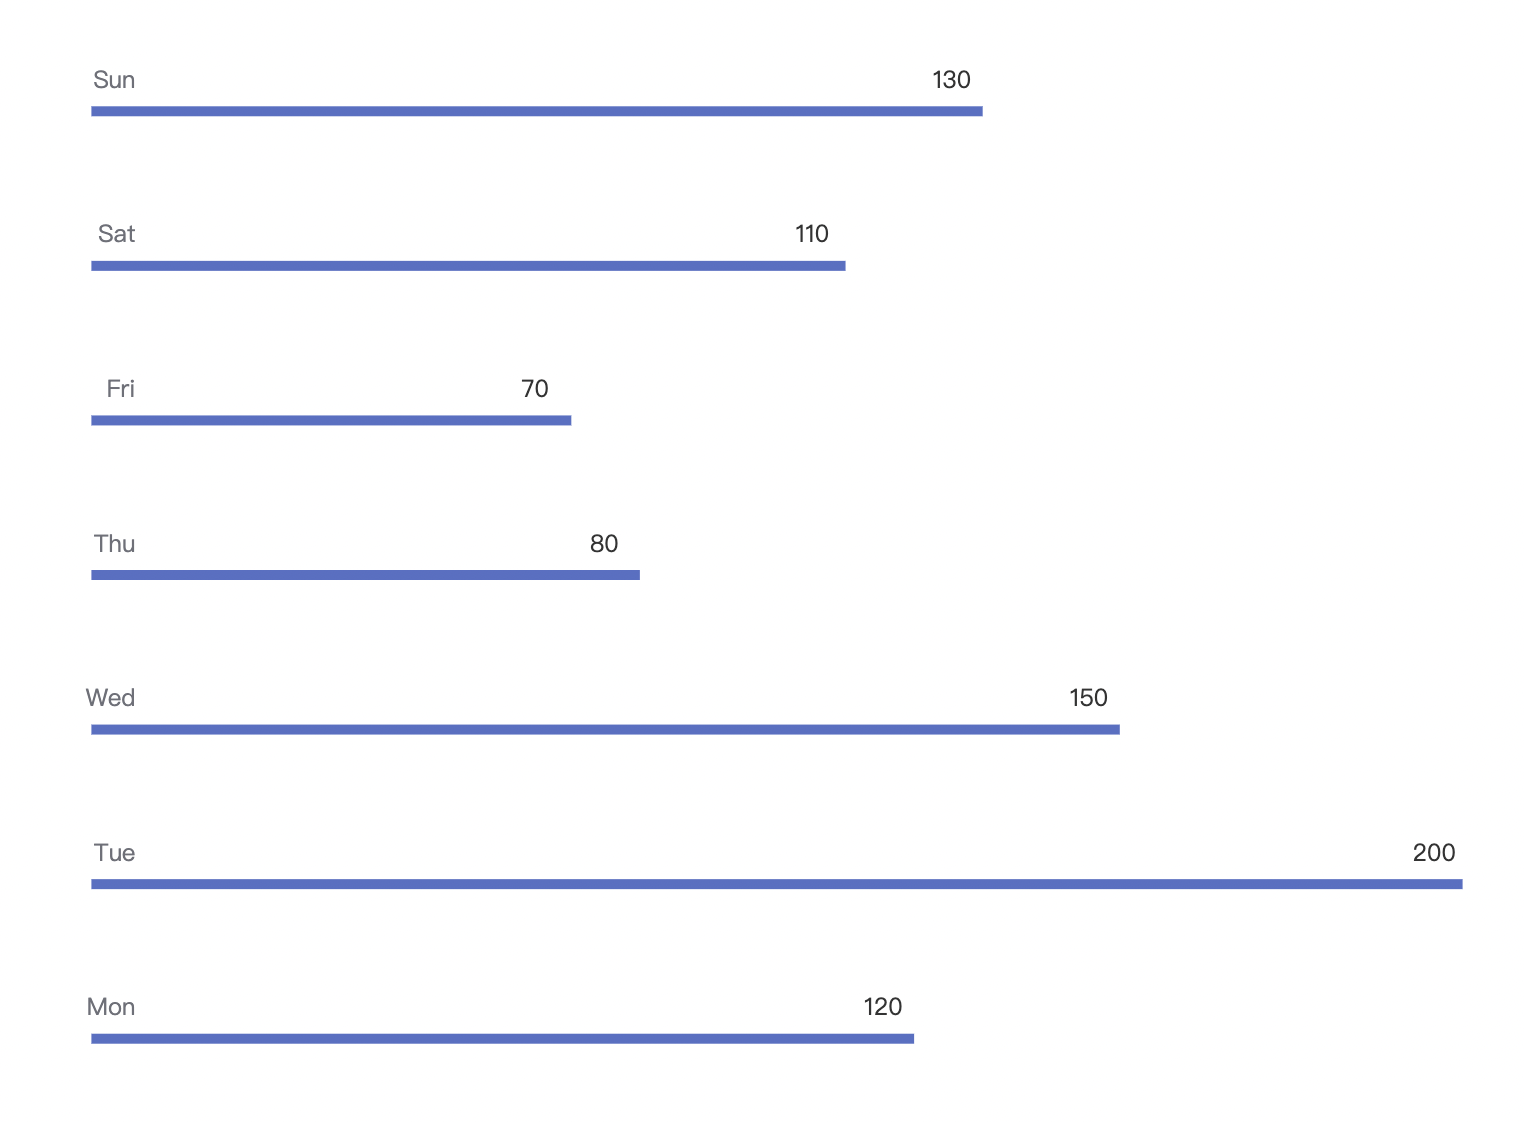
柱状图渲染进度条效果
option = {
  yAxis: {
    type: 'category',
    data: ['Mon', 'Tue', 'Wed', 'Thu', 'Fri', 'Sat', 'Sun'],
    axisTick: {
      show: false
    },
    axisLine: {
      show: false,
    },
    axisLabel: {
      verticalAlign: 'bottom',  //看这里
      align:'right',//看这里
      padding: [0,-30,10,0], //看这里
    },
  },
  xAxis: {
    type: 'value',
    splitLine: {
      show: false
    },
    show: false,
  },
  series: [
    {
      data: [120, 200, 150, 80, 70, 110, 130],
      type: 'bar',
      barWidth: 5,
      label: {
        show: true,
        position: 'right',
        verticalAlign: 'bottom',
        offset: [-30,-10],
      },
    }
  ]
};
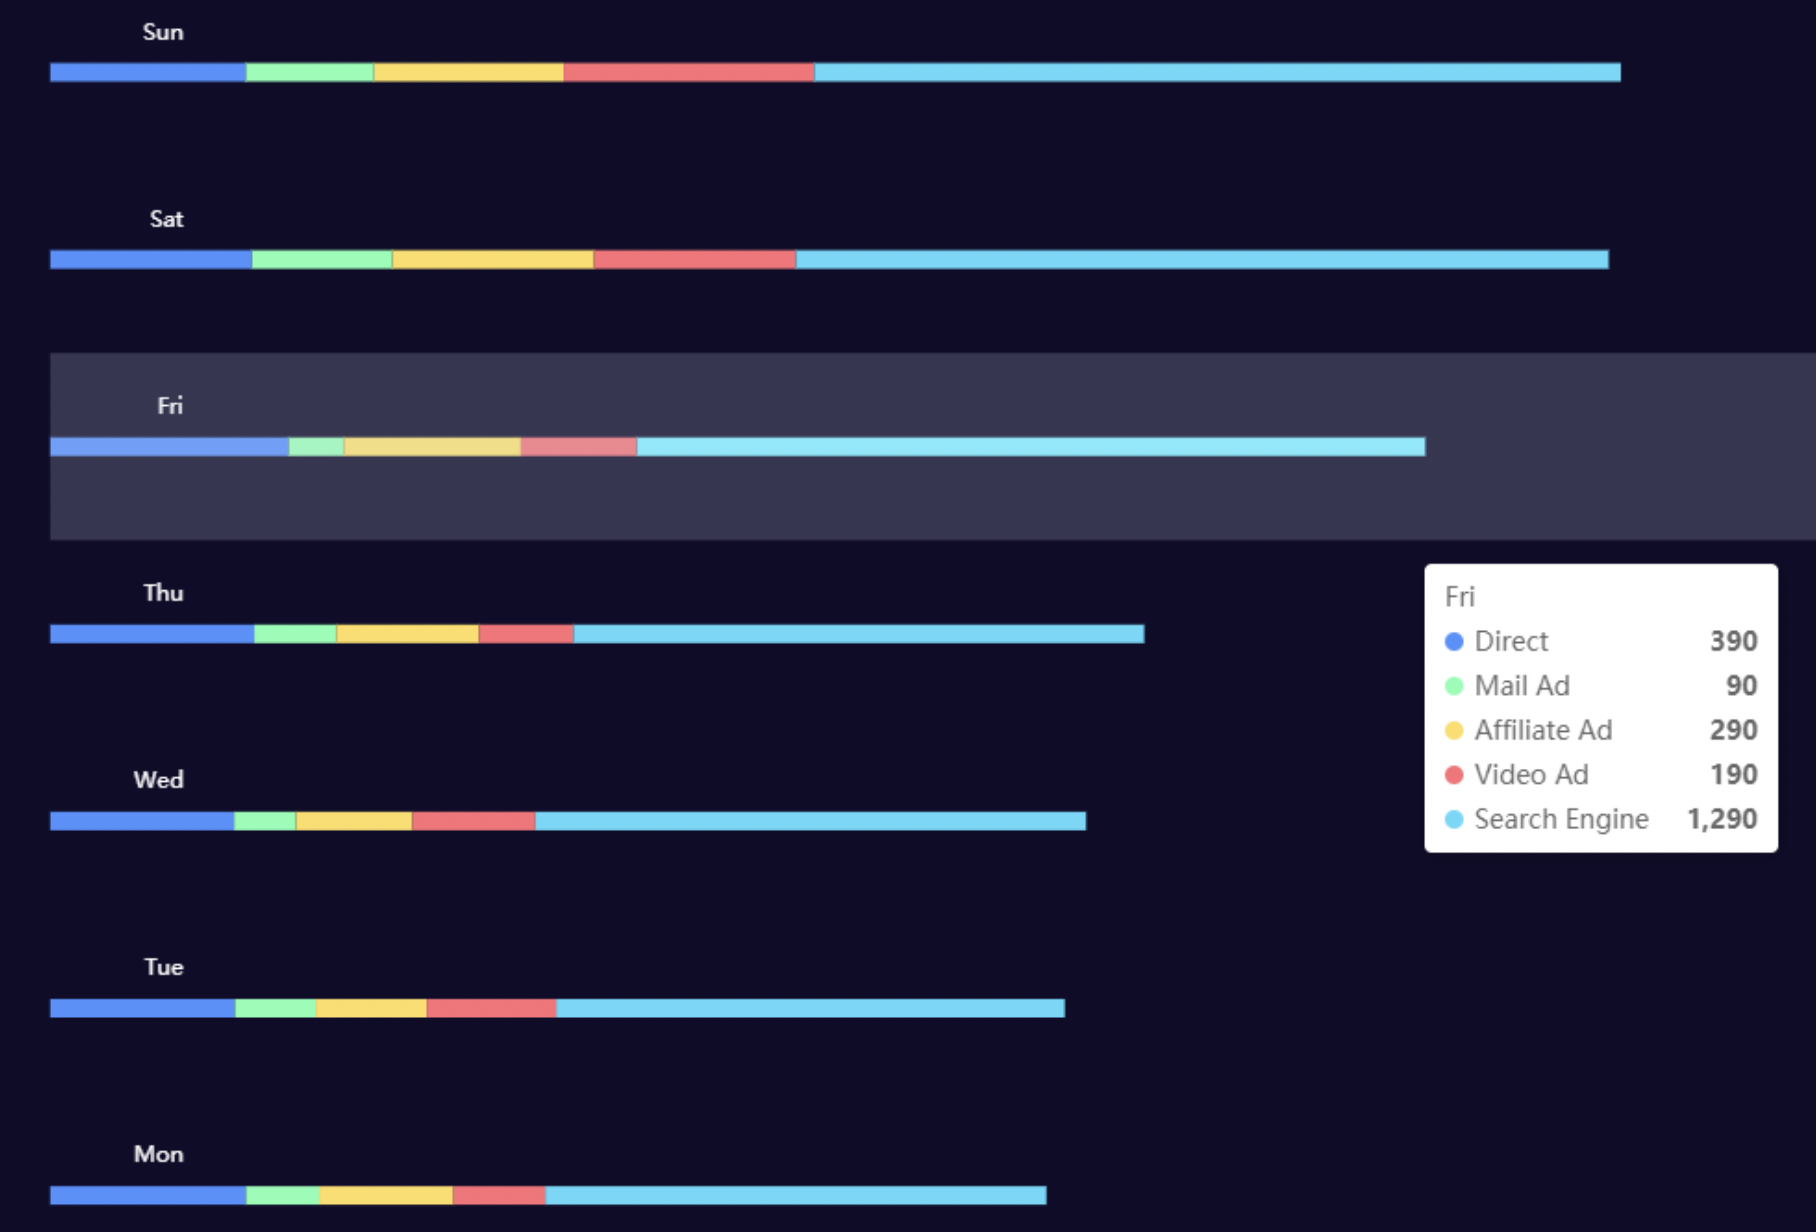
多拼接横向柱状图y轴名称偏移
option = {
    tooltip: {
        trigger: 'axis',
        axisPointer: {            // Use axis to trigger tooltip
            type: 'shadow'        // 'shadow' as default; can also be 'line' or 'shadow'
        }
    },
    legend: {
        show:false,
        data: ['Direct', 'Mail Ad', 'Affiliate Ad', 'Video Ad', 'Search Engine']
    },
    grid: {
        left: '3%',
        right: '4%',
        bottom: '3%',
        containLabel: true
    },
    xAxis: {
        show:false,
        type: 'value',
    },
    yAxis: {
        type: 'category',
        data: ['Mon', 'Tue', 'Wed', 'Thu', 'Fri', 'Sat', 'Sun'],
        left:'20%',
        top:'80%',
        axisTick: {
                //刻度线
            show: false
        },
        axisLine:{
            lineStyle:{
                width:0,
            }
        },
        axisLabel:{
            textStyle:{
            	color:"#fff"
        		},
        		verticalAlign: 'bottom',  //看这里
        		align:'right',//看这里
        		//调整文字上右下左
        		padding: [0,-80,15,0],//看这里
				}
    },
    series: [
        {
            name: 'Direct',
            type: 'bar',
            stack: 'total',
            label: {
                show: false
            },
            emphasis: {
                focus: 'series'
            },
            barWidth:10,
            data: [320, 302, 301, 334, 390, 330, 320]
        },
        {
            name: 'Mail Ad',
            type: 'bar',
            stack: 'total',
            label: {
                show: false
            },
            emphasis: {
                focus: 'series'
            },
            data: [120, 132, 101, 134, 90, 230, 210]
        },
        {
            name: 'Affiliate Ad',
            type: 'bar',
            stack: 'total',
            label: {
                show: false
            },
            emphasis: {
                focus: 'series'
            },
            data: [220, 182, 191, 234, 290, 330, 310]
        },
        {
            name: 'Video Ad',
            type: 'bar',
            stack: 'total',
            label: {
                show: false
            },
            emphasis: {
                focus: 'series'
            },
            data: [150, 212, 201, 154, 190, 330, 410]
        },
        {
            name: 'Search Engine',
            type: 'bar',
            stack: 'total',
            label: {
                show: false
            },
            emphasis: {
                focus: 'series'
            },
            data: [820, 832, 901, 934, 1290, 1330, 1320]
        }
    ]
};
标签:false,
show,
data,
进度条,
柱状图,
series,
bar,
type,
Echarts
From: https://www.cnblogs.com/Plume-blogs/p/16636316.html